
Compare Indo Count Inds. with Similar Stocks
Dashboard
Poor long term growth as Operating profit has grown by an annual rate -8.92% of over the last 5 years
With a fall in Operating Profit of -0.94%, the company declared Very Negative results in Mar 26
With ROCE of 6.9, it has a Expensive valuation with a 2.2 Enterprise value to Capital Employed
Stock DNA
Garments & Apparels
INR 6,721 Cr (Small Cap)
51.00
23
0.60%
0.44
5.38%
2.82
Total Returns (Price + Dividend) 
Latest dividend: 2 per share ex-dividend date: Aug-11-2025
Risk Adjusted Returns v/s
Returns Beta

News
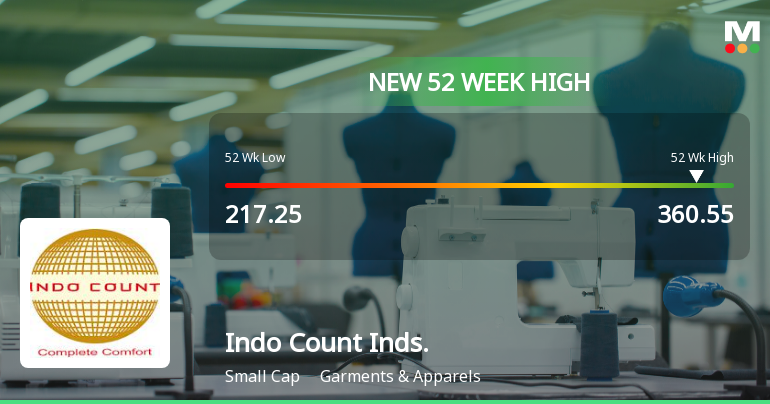
Broad-Based Technical Strength Lifts Indo Count Industries Ltd to 52-Week High of Rs 360.55
With a decisive surge to Rs 360.55 on 3 Jun 2026, Indo Count Industries Ltd has reached a fresh 52-week high, marking a 66% rally from its low of Rs 217.25 over the past year. This milestone comes amid a backdrop of broad technical alignment and sustained price momentum, setting the stock apart in a market where the Sensex has struggled near its own lows.
Read full news article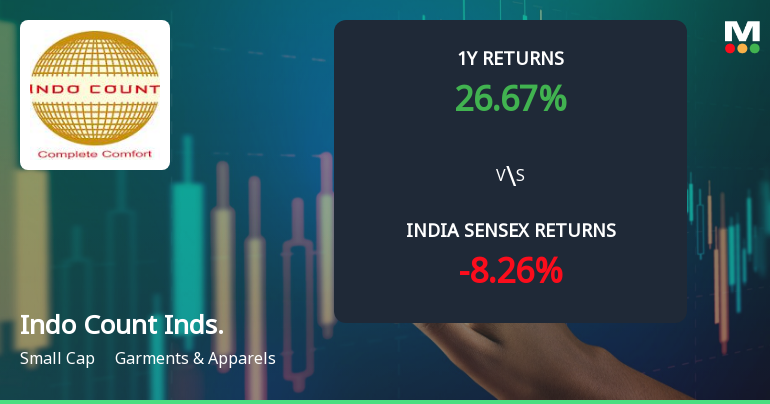
Indo Count Industries Ltd Shows Bullish Momentum Amid Technical Upgrades
Indo Count Industries Ltd has demonstrated a notable shift in price momentum, supported by a series of bullish technical indicators across multiple timeframes. The garment and apparels company’s stock price surged 3.36% on 3 June 2026, closing at ₹346.45, signalling renewed investor confidence and a potential uptrend continuation.
Read full news article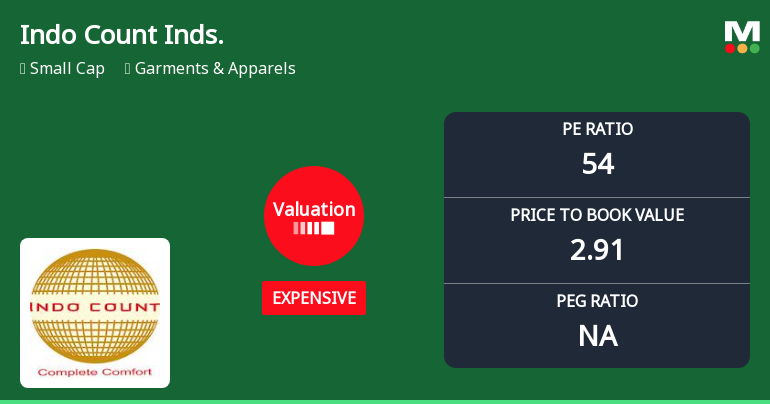
Indo Count Industries Ltd Valuation Shifts Amid Strong Market Returns
Indo Count Industries Ltd has experienced a notable shift in its valuation parameters, moving from a fair to an expensive rating, reflecting a significant change in price attractiveness. Despite strong stock returns outperforming the Sensex across multiple timeframes, the company’s elevated price-to-earnings and price-to-book ratios warrant a closer examination for investors assessing its current market appeal.
Read full news article Announcements
Announcement under Regulation 30 (LODR)-Earnings Call Transcript
08-Jun-2026 | Source : BSETranscript of the Investors Conference Call held on 1st June 2026 for Q4 & FY 26.
Corrigendum To The Intimation Under Regulation 30 Of The SEBI (Listing Obligations And Disclosure Requirements) Regulations 2015 (SEBI Listing Regulations) Regarding Capacity Addition
01-Jun-2026 | Source : BSEWe wish to inform that this corrigendum to rectify an inadvertent clerical error regarding the expected period of the project becoming operational/ commissioned. Accordingly the timeline should be read as by Q2 of FY 2028 instead of by Q2 of FY 2027
Announcement under Regulation 30 (LODR)-Analyst / Investor Meet - Outcome
01-Jun-2026 | Source : BSEAudio Recording of the Investors Conference Call held on 1st June 2026 for Q4 & FY26 Results
Corporate Actions

No Upcoming Board Meetings

Indo Count Industries Ltd has declared 100% dividend, ex-date: 11 Aug 25

Indo Count Industries Ltd has announced 2:10 stock split, ex-date: 11 Nov 16

No Bonus history available

No Rights history available
Quality key factors
Valuation key factors
Technicals key factors
 Technical Indicator Scale: Bearish, Mildly Bearish, Sideways, Mildly Bullish, Bullish Turned
 Shareholding Snapshot : Mar 2026
Shareholding Compare (%holding)
Promoters
None
Held by 13 Schemes (4.79%)
Held by 83 FIIs (9.85%)
Sandridge Investments Limited (31.31%)
Elm Park Fund Limited (5.2%)
17.82%
Quarterly Results Snapshot (Consolidated) - Mar'26 - YoY

YoY Growth in quarter ended Mar 2026 is 3.43% vs -6.47% in Mar 2025
YoY Growth in quarter ended Mar 2026 is 14.96% vs -77.10% in Mar 2025
Half Yearly Results Snapshot (Consolidated) - Sep'25

Growth in half year ended Sep 2025 is 2.20% vs 12.96% in Sep 2024
Growth in half year ended Sep 2025 is -50.66% vs -15.83% in Sep 2024
Nine Monthly Results Snapshot (Consolidated) - Dec'25
YoY Growth in nine months ended Dec 2025 is -1.44% vs 26.99% in Dec 2024
YoY Growth in nine months ended Dec 2025 is -55.24% vs -6.92% in Dec 2024
Annual Results Snapshot (Consolidated) - Mar'26
YoY Growth in year ended Mar 2026 is -0.24% vs 16.71% in Mar 2025
YoY Growth in year ended Mar 2026 is -49.33% vs -26.02% in Mar 2025
About Indo Count Industries Ltd

Company Coordinates


