
Compare Indo Euro Indch. with Similar Stocks
Dashboard
Weak Long Term Fundamental Strength with an average Return on Equity (ROE) of 4.19%
- Poor long term growth as Net Sales has grown by an annual rate of 12.53% and Operating profit at 4.73% over the last 5 years
- Company's ability to service its debt is weak with a poor EBIT to Interest (avg) ratio of 0.16
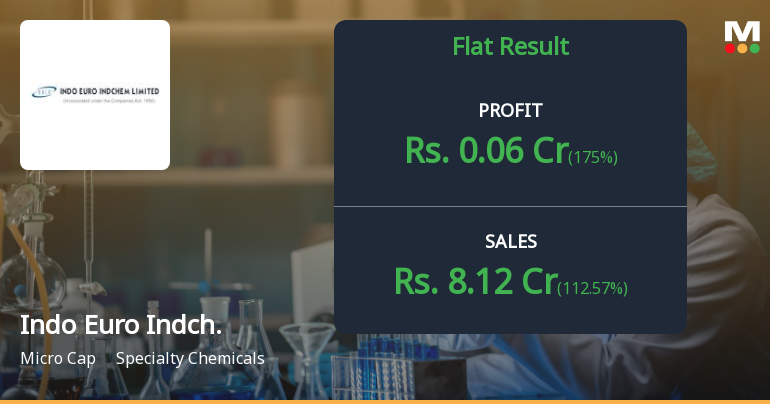
Flat results in Mar 26
Risky - Negative Operating Profits
Consistent Underperformance against the benchmark over the last 3 years
Stock DNA
Specialty Chemicals
INR 9 Cr (Micro Cap)
25.00
23
0.00%
-0.01
2.66%
0.76
Total Returns (Price + Dividend) 
Indo Euro Indch. for the last several years.
Risk Adjusted Returns v/s
Returns Beta

News
Indo Euro Indchem Q4 FY26: Revenue Surge Masks Underlying Operational Weakness
Indo Euro Indchem Limited, a micro-cap specialty chemicals company with a market capitalisation of ₹9.93 crores, reported a net profit of ₹0.06 crores for Q4 FY26 (January-March 2026), representing a modest sequential improvement but continuing a pattern of volatile quarterly performance. The stock traded at ₹10.97 on May 15, down 30.30% over the past year and significantly underperforming both the Sensex and the specialty chemicals sector.
Read full news article Announcements
Closure of Trading Window
30-Jun-2026 | Source : BSEClosure of Trading Window
Announcement under Regulation 30 (LODR)-Newspaper Publication
16-May-2026 | Source : BSENewspaper Advertisements
Board Meeting Outcome for Board Meeting Outcome For Financial Results For The Fourth Quarter And Financial Year Ended On March 31 2026
14-May-2026 | Source : BSEFinancial Results for The Fourth Quarter and Financial Year ended on March 31 2026
Corporate Actions

No Upcoming Board Meetings

No Dividend history available

No Splits history available

No Bonus history available

No Rights history available
Quality key factors
Valuation key factors
Technicals key factors
 Technical Indicator Scale: Bearish, Mildly Bearish, Sideways, Mildly Bullish, Bullish Turned
 Shareholding Snapshot : Mar 2026
Shareholding Compare (%holding)
Promoters
None
Held by 0 Schemes
Held by 0 FIIs
Vardhman Chhaganlal Shah (26.57%)
Shah Paresh Laxmichand (1.47%)
41.54%
Quarterly Results Snapshot (Standalone) - Mar'26 - YoY

YoY Growth in quarter ended Mar 2026 is 112.57% vs -48.45% in Mar 2025
YoY Growth in quarter ended Mar 2026 is 175.00% vs -500.00% in Mar 2025
Half Yearly Results Snapshot (Standalone) - Sep'25

Growth in half year ended Sep 2025 is -25.51% vs 143.33% in Sep 2024
Growth in half year ended Sep 2025 is 4.35% vs 2,200.00% in Sep 2024
Nine Monthly Results Snapshot (Standalone) - Dec'25
YoY Growth in nine months ended Dec 2025 is -44.29% vs 195.31% in Dec 2024
YoY Growth in nine months ended Dec 2025 is -43.18% vs 2,100.00% in Dec 2024
Annual Results Snapshot (Standalone) - Mar'26
YoY Growth in year ended Mar 2026 is -1.15% vs 28.37% in Mar 2025
YoY Growth in year ended Mar 2026 is -11.11% vs 800.00% in Mar 2025
About Indo Euro Indchem Ltd

Company Coordinates


