
Compare Indo Farm Equip. with Similar Stocks
Dashboard
Weak Long Term Fundamental Strength with an average Return on Equity (ROE) of 4.39%
- Poor long term growth as Net Sales has grown by an annual rate of 2.90% and Operating profit at 4.91% over the last 5 years
Falling Participation by Institutional Investors
Below par performance in long term as well as near term
Total Returns (Price + Dividend) 
Indo Farm Equip. for the last several years.
Risk Adjusted Returns v/s
Returns Beta

News
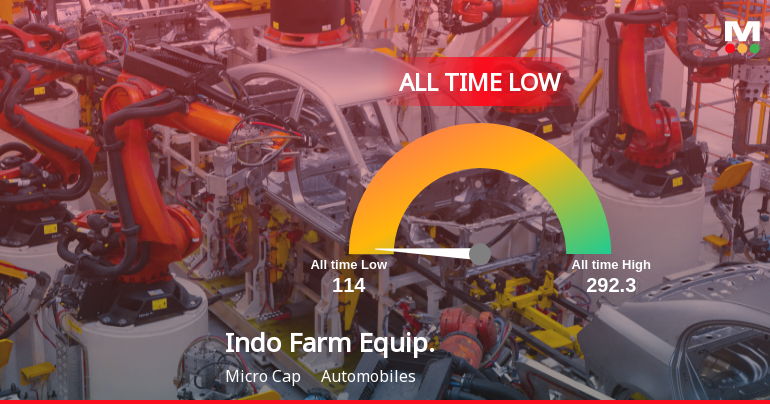
Markets Rise, But Indo Farm Equipment Ltd Slides to All-Time Low Amid Stock-Specific Sell-Off
Despite a broadly positive market environment, Indo Farm Equipment Ltd has succumbed to a sharp decline, hitting a fresh all-time low of Rs 110.95 on 30 Mar 2026. The stock’s recent performance starkly contrasts with sector and benchmark indices, underscoring a pronounced divergence that demands closer scrutiny.
Read full news article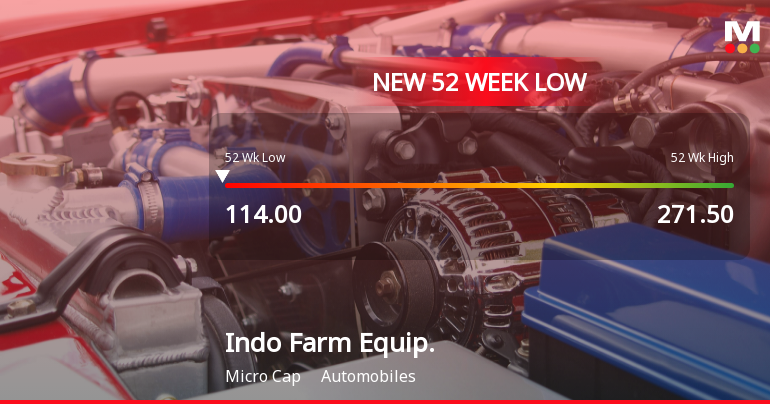
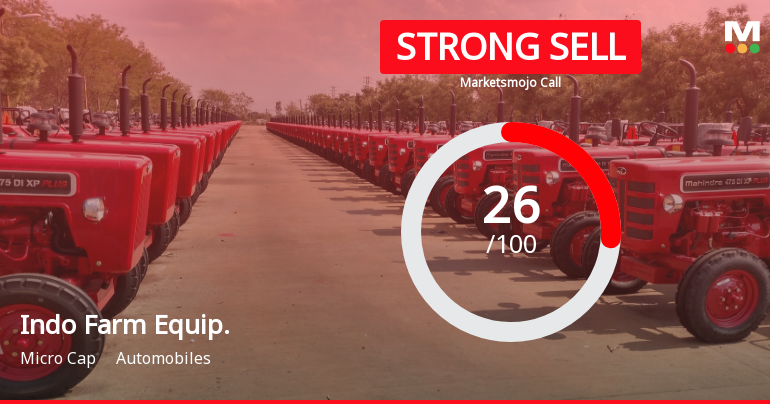
Indo Farm Equipment Ltd is Rated Strong Sell
Indo Farm Equipment Ltd is rated Strong Sell by MarketsMOJO, with this rating last updated on 02 Mar 2026. However, the analysis and financial metrics discussed here reflect the stock’s current position as of 25 March 2026, providing investors with the latest insights into its performance and outlook.
Read full news article Announcements
Regulation 30 Of The SEBI (LODR) Regulations 2015 (Listing Regulations)- Increase In Promoter/Promoter Group Shareholding In The Company.
27-Feb-2026 | Source : BSERegulation 30 of the SEBI (LODR) Regulation 2025-Increase in Promoter/Promoter Group shareholding in the Company.
Regulation 30 Of The SEBI (LODR) Regulations 2015 (Listing Regulations)- Increase In Promoter/Promoter Group Shareholding In The Company.
17-Feb-2026 | Source : BSERegulation 30 of the SEBI (LODR) Regulations 2015 -Increase in Promoter/Promoter Group shareholding in the Company.
Announcement under Regulation 30 (LODR)-Earnings Call Transcript
17-Feb-2026 | Source : BSETranscript of Earning/Investors call held on February 12 2026.
Corporate Actions

No Upcoming Board Meetings

No Dividend history available

No Splits history available

No Bonus history available

No Rights history available
Quality key factors
Valuation key factors
Technicals key factors
 Technical Indicator Scale: Bearish, Mildly Bearish, Sideways, Mildly Bullish, Bullish Turned
 Shareholding Snapshot : Dec 2025
Shareholding Compare (%holding)
Promoters
None
Held by 0 Schemes
Held by 5 FIIs (0.01%)
Ranbir Singh Khadwalia (35.02%)
Negen Undiscovered Value Fund (1.99%)
21.45%
Quarterly Results Snapshot (Standalone) - Dec'25 - QoQ

QoQ Growth in quarter ended Dec 2025 is 1.59% vs 8.55% in Sep 2025

QoQ Growth in quarter ended Dec 2025 is 4.28% vs -3.06% in Sep 2025
Half Yearly Results Snapshot (Standalone) - Sep'25
Not Applicable: The company has declared_date for only one period
Not Applicable: The company has declared_date for only one period
Nine Monthly Results Snapshot (Standalone) - Dec'25
Not Applicable: The company has declared_date for only one period
Not Applicable: The company has declared_date for only one period
Annual Results Snapshot (Consolidated) - Mar'25
YoY Growth in year ended Mar 2025 is 3.19% vs 1.21% in Mar 2024
YoY Growth in year ended Mar 2025 is 51.06% vs 0.19% in Mar 2024
About Indo Farm Equipment Ltd

Company Coordinates


