
Compare Indo US Bio-Tech with Similar Stocks
Stock DNA
Other Agricultural Products
INR 170 Cr (Micro Cap)
13.00
34
0.00%
0.31
15.14%
1.91
Total Returns (Price + Dividend) 
Latest dividend: 0.2 per share ex-dividend date: Dec-03-2024
Risk Adjusted Returns v/s
Returns Beta

News
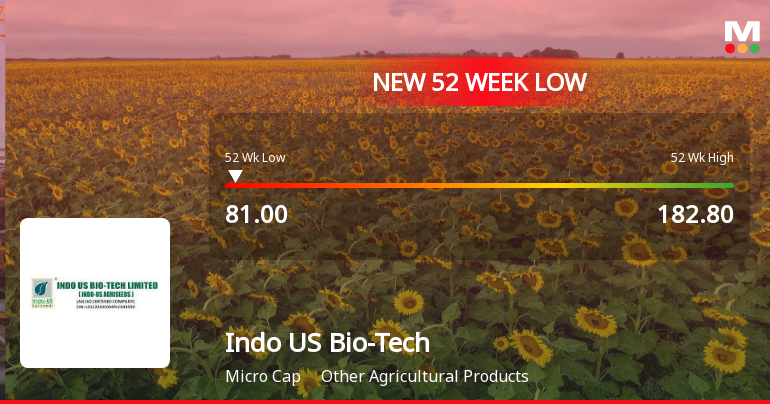
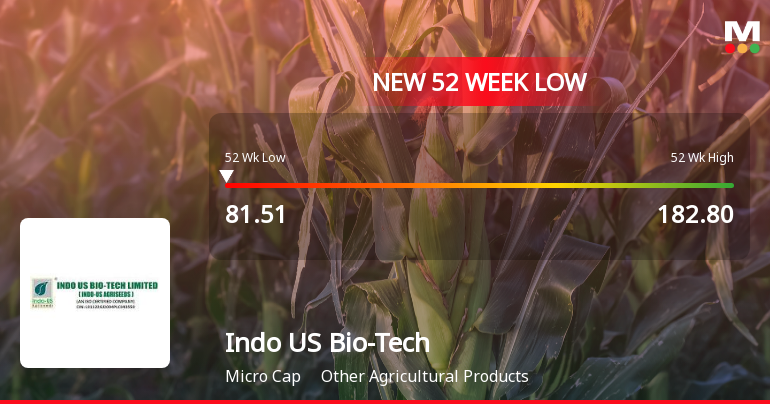
Five Consecutive Losses Push Indo US Bio-Tech Ltd to a New 52-Week Low
For the fifth straight session, Indo US Bio-Tech Ltd closed lower, breaching its 52-week low at Rs 81.51 on 28 Jul 2026, marking a significant decline from its peak of Rs 182.80 within the last year.
Read full news article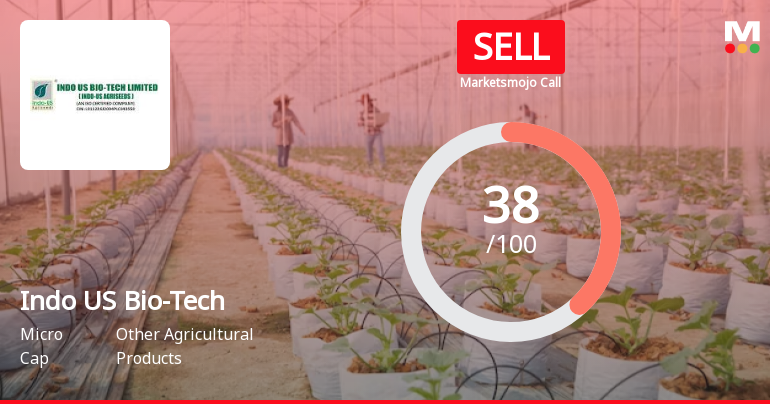
Indo US Bio-Tech Ltd is Rated Sell
Indo US Bio-Tech Ltd is rated Sell by MarketsMOJO, with this rating last updated on 19 January 2026. However, the analysis and financial metrics discussed here reflect the company’s current position as of 27 July 2026, providing investors with an up-to-date view of the stock’s fundamentals, returns, and technical outlook.
Read full news article Announcements
Revised: Additional Details Required For Corporate Announcement Filed Under Regulation 30 Of SEBI (LODR) Regulations 2015. Ref.: Mail From Query.Lodr@Bseindia.Com On 13.07.2026 Subject: Resignation Of Statutory Auditor And Appointment Of New Statutory Aud
15-Jul-2026 | Source : BSERevised announcement submit.
Revised Outcome Of The Board Meeting Held On 10 July 2026. Reconstitution Of Committees.
15-Jul-2026 | Source : BSECommittee Composition approved in the Outcome of Board Meeting dated 10th July 2026 shall be read as effective from 21st April 2026 being the effective date of the Appointment and resignation of the concerned Directors. Mrs. Neha Patel resigned and Mrs. Hemanshi Darsh Soni is appointed in the meeting of Board of Directors held on 21st April 2026.
Board Meeting Outcome for Change In Composition Of Committees Of The Board. Outcome Of Board Meeting Under Regulation 30 Of The SEBI (Listing Obligations And Disclosure Requirements) Regulations 2015.
10-Jul-2026 | Source : BSEPursuant to the resignation of Mrs. Nehaben Patel (DIN: 09263180) from the office of Non-Executive Independent Director of the Company the Board of Directors at its meeting held on 21st April 2026 appointed Mrs. Hemanshi Darsh Soni (DIN: 11659183) as an Additional Director (Non-Executive Independent) of the Company subject to the approval of the shareholders. Consequently the Board of Directors of the Company at its meeting held on Friday July 10 2026 has approved the reconstitution of the composition of the aforesaid Committees of the Board with effect from 10th July 2026 in order to ensure compliance with the applicable provisions of the SEBI (Listing Obligations and Disclosure Requirements) Regulations 2015 and the Companies Act 2013 wherever applicable. The Board Meeting commenced at 15.00 P.M. and concluded at 15:30 P.M. Please take the same on your record and oblige.
Corporate Actions

No Upcoming Board Meetings

Indo US Bio-Tech Ltd has declared 2% dividend, ex-date: 03 Dec 24

No Splits history available

Indo US Bio-Tech Ltd has announced 1:1 bonus issue, ex-date: 29 Aug 23

No Rights history available
Quality key factors
Valuation key factors
Technicals key factors
 Technical Indicator Scale: Bearish, Mildly Bearish, Sideways, Mildly Bullish, Bullish Turned
 Shareholding Snapshot : Jun 2026
Shareholding Compare (%holding)
Promoters
None
Held by 0 Schemes
Held by 1 FIIs (0.01%)
Jagdishkumar Devjibhai Ajudiya (48.82%)
Improwised Technologies Private (1.99%)
24.51%
Quarterly Results Snapshot (Standalone) - Mar'26 - QoQ

QoQ Growth in quarter ended Mar 2026 is 14.12% vs -26.09% in Dec 2025

QoQ Growth in quarter ended Mar 2026 is -34.33% vs -13.04% in Dec 2025
Half Yearly Results Snapshot (Standalone) - Sep'25
Growth in half year ended Sep 2025 is 31.41% vs 23.79% in Sep 2024
Growth in half year ended Sep 2025 is 8.23% vs 78.86% in Sep 2024
Nine Monthly Results Snapshot (Standalone) - Dec'25
YoY Growth in nine months ended Dec 2025 is 19.83% vs 23.44% in Dec 2024
YoY Growth in nine months ended Dec 2025 is -11.37% vs 62.95% in Dec 2024
Annual Results Snapshot (Standalone) - Mar'26
YoY Growth in year ended Mar 2026 is 6.36% vs 42.56% in Mar 2025
YoY Growth in year ended Mar 2026 is -19.36% vs 97.45% in Mar 2025
About Indo US Bio-Tech Ltd

Company Coordinates


