
Compare Indoco Remedies with Similar Stocks
Dashboard
Weak Long Term Fundamental Strength with a -28.83% CAGR growth in Operating Profits over the last 5 years
- Low ability to service debt as the company has a high Debt to EBITDA ratio of 7.69 times
- The company has been able to generate a Return on Equity (avg) of 7.83% signifying low profitability per unit of shareholders funds
The company has declared Negative results for the last 15 consecutive quarters
Consistent Underperformance against the benchmark over the last 3 years
Stock DNA
Pharmaceuticals & Biotechnology
INR 2,025 Cr (Small Cap)
NA (Loss Making)
37
0.09%
1.13
-9.82%
2.15
Total Returns (Price + Dividend) 
Latest dividend: 0.2 per share ex-dividend date: Sep-04-2025
Risk Adjusted Returns v/s
Returns Beta

News
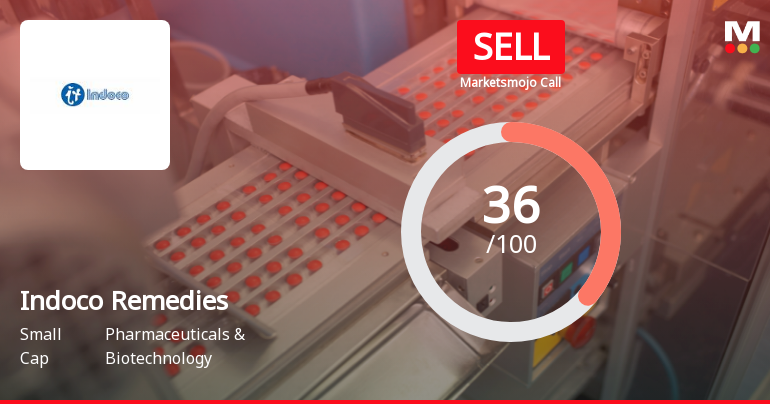
Indoco Remedies Ltd Upgraded to Sell on Technical Improvement Despite Weak Fundamentals
Indoco Remedies Ltd, a small-cap player in the Pharmaceuticals & Biotechnology sector, has seen its investment rating upgraded from Strong Sell to Sell as of 29 July 2026. This change is primarily driven by a shift in technical indicators, despite ongoing challenges in financial performance and valuation metrics. The company’s stock currently trades at ₹225.15, down 1.29% on the day, reflecting mixed signals for investors navigating a complex market environment.
Read full news article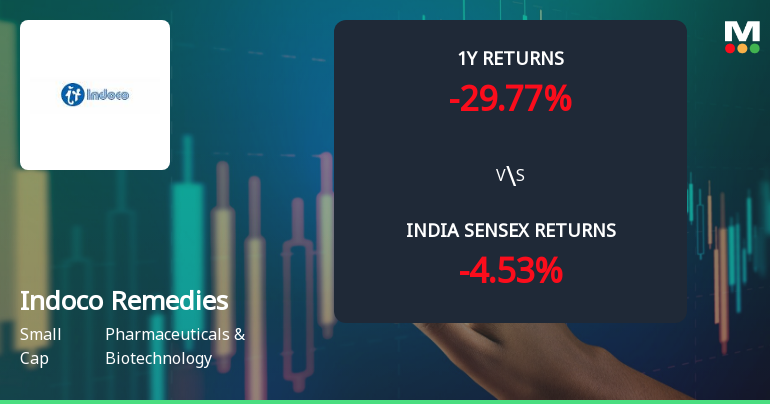
Indoco Remedies Ltd Technical Momentum Shifts Amid Mixed Market Signals
Indoco Remedies Ltd has experienced a subtle but notable shift in its technical momentum, moving from a mildly bearish to a mildly bullish trend as of late July 2026. Despite a recent downgrade in its Mojo Grade to 'Sell' from 'Strong Sell', the stock’s technical indicators present a complex picture, reflecting mixed signals across weekly and monthly timeframes. This analysis delves into the evolving price momentum, key technical indicators, and comparative market performance to provide investors with a comprehensive view of the stock’s current standing.
Read full news article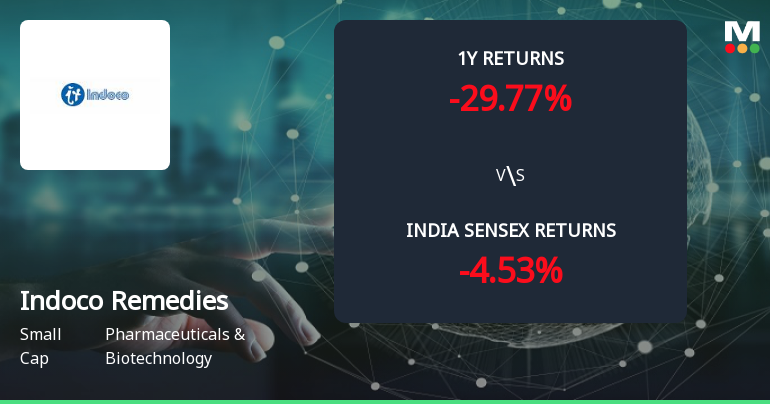
Golden Cross Forms in Indoco Remedies Ltd — On a Day the Stock Fell 1.29%. What the Mixed Signals Mean
The 50-day moving average has crossed above the 200-day moving average for Indoco Remedies Ltd, signalling a golden cross on 29 Jul 2026. Yet, the stock declined 1.29% on the same day, while monthly technical indicators remain bearish. This juxtaposition of signals calls for a detailed examination of the underlying data to assess the reliability of this technical event.
Read full news article Announcements
Announcement under Regulation 30 (LODR)-Newspaper Publication
29-Jul-2026 | Source : BSEPublication of Unaudited Standalone and Consolidated Financial Results for the quarter ended 30-06-2026
Announcement under Regulation 30 (LODR)-Analyst / Investor Meet - Outcome
28-Jul-2026 | Source : BSEAudio recording of Earnings Conference Call on Unaudited Standalone & Consolidated Financial Results for the quarter ended 30-06-2026
Announcement under Regulation 30 (LODR)-Change in Management
28-Jul-2026 | Source : BSEThe Board of Directors in its Meeting held today i.e. 28th July 2026 has considered and approved 1. Re-appointment of Ms. Aditi Panandikar as the Managing Director of the Company for the period of 5 years commencing from 15th February 2027 to 14th February 2032 subject to the approval of the shareholders in the ensuing AGM. 2. Appointment of Mr. Sudhir Kadam as Senior Management Personnel designated as Sr. Vice President (Human Capital) of the Company w.e.f. 28th July 2026
Corporate Actions

No Upcoming Board Meetings

Indoco Remedies Ltd has declared 10% dividend, ex-date: 04 Sep 25

Indoco Remedies Ltd has announced 2:10 stock split, ex-date: 17 May 12

Indoco Remedies Ltd has announced 1:2 bonus issue, ex-date: 17 May 12

No Rights history available
Quality key factors
Valuation key factors
Technicals key factors
 Technical Indicator Scale: Bearish, Mildly Bearish, Sideways, Mildly Bullish, Bullish Turned
 Shareholding Snapshot : Jun 2026
Shareholding Compare (%holding)
Promoters
None
Held by 7 Schemes (17.16%)
Held by 34 FIIs (1.27%)
Spa Holdings Pvt Ltd (19.86%)
Nippon Life India Trustee Ltd A/c Nippon India Small Cap Fund (4.8%)
16.68%
Quarterly Results Snapshot (Consolidated) - Jun'26 - QoQ

QoQ Growth in quarter ended Jun 2026 is -1.71% vs 6.79% in Mar 2026

QoQ Growth in quarter ended Jun 2026 is 400.32% vs 27.36% in Mar 2026
Half Yearly Results Snapshot (Consolidated) - Sep'25
Growth in half year ended Sep 2025 is 6.97% vs -4.85% in Sep 2024
Growth in half year ended Sep 2025 is -529.83% vs -111.67% in Sep 2024
Nine Monthly Results Snapshot (Consolidated) - Dec'25
YoY Growth in nine months ended Dec 2025 is 7.45% vs -6.80% in Dec 2024
YoY Growth in nine months ended Dec 2025 is -120.52% vs -143.99% in Dec 2024
Annual Results Snapshot (Consolidated) - Mar'26
YoY Growth in year ended Mar 2026 is 10.84% vs -8.38% in Mar 2025
YoY Growth in year ended Mar 2026 is -29.03% vs -174.89% in Mar 2025
About Indoco Remedies Ltd

Company Coordinates


