
Compare Indoco Remedies with Similar Stocks
Dashboard
Weak Long Term Fundamental Strength with a -36.71% CAGR growth in Operating Profits over the last 5 years
- Low ability to service debt as the company has a high Debt to EBITDA ratio of 7.69 times
- The company has been able to generate a Return on Equity (avg) of 7.83% signifying low profitability per unit of shareholders funds
The company has declared Negative results for the last 14 consecutive quarters
Consistent Underperformance against the benchmark over the last 3 years
Stock DNA
Pharmaceuticals & Biotechnology
INR 1,906 Cr (Small Cap)
NA (Loss Making)
34
0.10%
1.13
-9.82%
2.02
Total Returns (Price + Dividend) 
Latest dividend: 0.2 per share ex-dividend date: Sep-04-2025
Risk Adjusted Returns v/s
Returns Beta

News
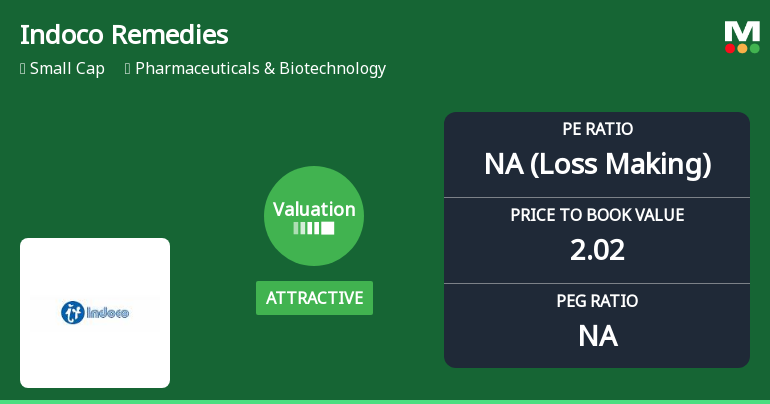
Indoco Remedies Ltd Valuation Shifts Signal Renewed Price Attractiveness Amid Sector Challenges
Indoco Remedies Ltd has witnessed a notable shift in its valuation parameters, moving from a fair to an attractive rating despite ongoing sector headwinds. This repositioning comes amid a backdrop of subdued returns relative to the broader market and a deteriorating profitability profile, raising important considerations for investors evaluating its price attractiveness against peers and historical benchmarks.
Read full news article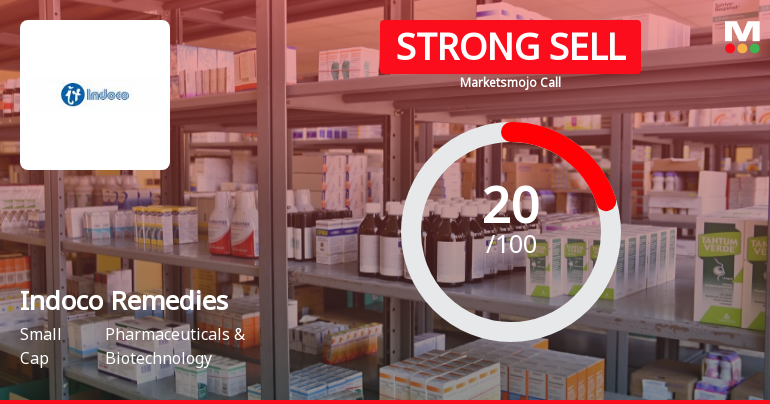
Indoco Remedies Ltd is Rated Strong Sell
Indoco Remedies Ltd is rated Strong Sell by MarketsMOJO, with this rating last updated on 08 May 2026. However, the analysis and financial metrics discussed here reflect the stock’s current position as of 02 June 2026, providing investors with the latest insights into the company’s performance and outlook.
Read full news article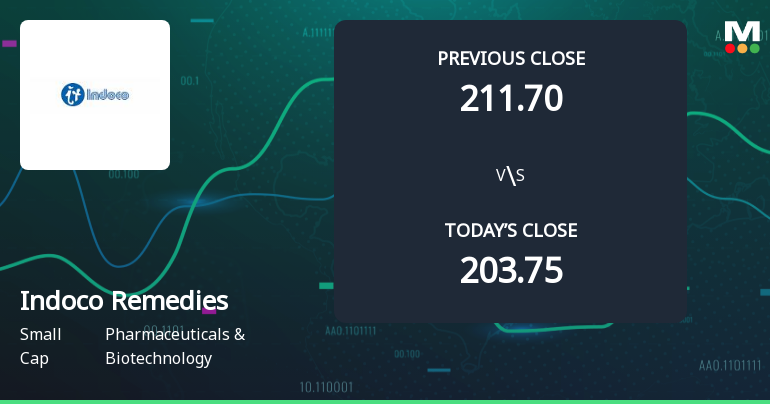
Announcements
Announcement under Regulation 30 (LODR)-Press Release / Media Release
28-May-2026 | Source : BSEIndocos formulation plant at Baddi (Plant III) receives EU GMP Certification
Compliances-Reg.24(A)-Annual Secretarial Compliance
22-May-2026 | Source : BSEEnclosed the Annual Secretarial Compliance Report dated 13-05-2026 for the Financial Year 2025-2026 issued by our Secretarial auditor CS Ajit Sathe Proprietor of M/s. A.Y.Sathe & Co Company Secretaries.
Announcement under Regulation 30 (LODR)-Memorandum of Understanding /Agreements
18-May-2026 | Source : BSEIntimation regarding completion of transfer of Ophthalmic Division of the Company to Sunways (India) Private Limited
Corporate Actions

No Upcoming Board Meetings

Indoco Remedies Ltd has declared 10% dividend, ex-date: 04 Sep 25

Indoco Remedies Ltd has announced 2:10 stock split, ex-date: 17 May 12

Indoco Remedies Ltd has announced 1:2 bonus issue, ex-date: 17 May 12

No Rights history available
Quality key factors
Valuation key factors
Technicals key factors
 Technical Indicator Scale: Bearish, Mildly Bearish, Sideways, Mildly Bullish, Bullish Turned
 Shareholding Snapshot : Mar 2026
Shareholding Compare (%holding)
Promoters
None
Held by 8 Schemes (17.54%)
Held by 28 FIIs (0.94%)
Spa Holdings Pvt Ltd (19.86%)
Nippon Life India Trustee Ltd-a/c Nippon India Small Cap Fund (4.8%)
16.56%
Quarterly Results Snapshot (Consolidated) - Mar'26 - QoQ

QoQ Growth in quarter ended Mar 2026 is 6.79% vs -8.11% in Dec 2025
QoQ Growth in quarter ended Mar 2026 is 27.36% vs -275.66% in Dec 2025
Half Yearly Results Snapshot (Consolidated) - Sep'25
Growth in half year ended Sep 2025 is 6.97% vs -4.85% in Sep 2024

Growth in half year ended Sep 2025 is -529.83% vs -111.67% in Sep 2024
Nine Monthly Results Snapshot (Consolidated) - Dec'25
YoY Growth in nine months ended Dec 2025 is 7.45% vs -6.80% in Dec 2024
YoY Growth in nine months ended Dec 2025 is -120.52% vs -143.99% in Dec 2024
Annual Results Snapshot (Consolidated) - Mar'26
YoY Growth in year ended Mar 2026 is 10.84% vs -8.38% in Mar 2025
YoY Growth in year ended Mar 2026 is -29.03% vs -174.89% in Mar 2025
About Indoco Remedies Ltd

Company Coordinates


