
Compare Indostar Capital with Similar Stocks
Dashboard
With a Operating Losses, the company has a Weak Long Term Fundamental Strength
- Poor long term growth as Operating profit has grown by an annual rate of -188.20%
- PBT LESS OI(Q) At Rs -424.03 cr has Fallen at -255.6% (vs previous 4Q average)
- PAT(Q) At Rs -423.93 cr has Fallen at -422.4% (vs previous 4Q average)
- CASH AND CASH EQUIVALENTS(HY) Lowest at Rs 310.38 cr
Risky - Negative EBITDA
Despite the size of the company, domestic mutual funds hold only 0% of the company
Underperformed the market in the last 1 year
Stock DNA
Non Banking Financial Company (NBFC)
INR 3,964 Cr (Small Cap)
NA (Loss Making)
21
0.00%
1.45
-20.12%
1.06
Total Returns (Price + Dividend) 
Latest dividend: 1 per share ex-dividend date: Nov-19-2019
Risk Adjusted Returns v/s
Returns Beta

News

Indostar Capital Finance Ltd Technical Momentum Shifts Amid Mixed Market Signals
Indostar Capital Finance Ltd has experienced a notable shift in its technical momentum, transitioning from a sideways trend to a mildly bearish stance. Despite a modest daily gain of 1.05%, the stock’s technical indicators present a complex picture, with mixed signals from MACD, RSI, moving averages, and other momentum oscillators, reflecting the challenges faced by this small-cap NBFC in the current market environment.
Read full news article
Indostar Capital Finance Ltd is Rated Strong Sell
Indostar Capital Finance Ltd is rated Strong Sell by MarketsMOJO, with this rating last updated on 12 May 2026. However, the analysis and financial metrics discussed here reflect the stock’s current position as of 15 June 2026, providing investors with the latest insights into the company’s performance and outlook.
Read full news article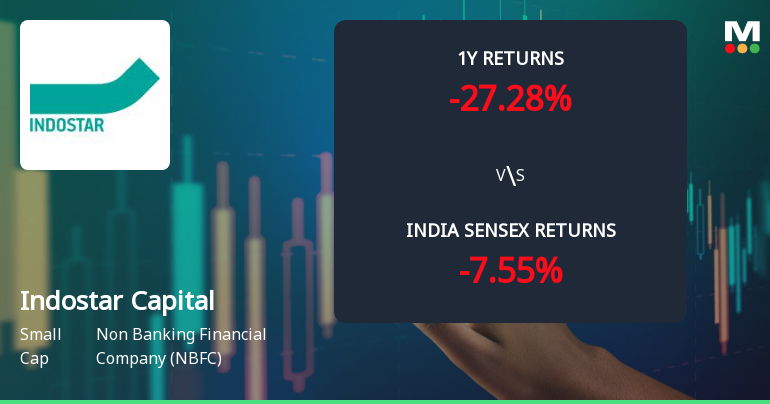
Indostar Capital Finance Ltd Technical Momentum Shifts Amid Mixed Market Signals
Indostar Capital Finance Ltd has exhibited a notable shift in its technical momentum, moving from a mildly bearish stance to a sideways trend, reflecting a complex interplay of bullish and bearish signals across multiple timeframes. Despite a recent day gain of 3.66%, the stock remains under pressure from its longer-term downtrend, as indicated by a strong sell rating and a small-cap market capitalisation.
Read full news article Announcements
Announcement under Regulation 30 (LODR)-Allotment of ESOP / ESPS
12-Jun-2026 | Source : BSEPlease find enclosed intimation regarding of ESOP dated June 12 2026
Announcement under Regulation 30 (LODR)-Allotment of ESOP / ESPS
10-Jun-2026 | Source : BSEPlease find enclosed intimation regarding of ESOP dated June 10 2026
Announcement under Regulation 30 (LODR)-Earnings Call Transcript
03-Jun-2026 | Source : BSEIndoStar Capital Finance Limited has informed the Exchange about Transcript
Corporate Actions

No Upcoming Board Meetings

Indostar Capital Finance Ltd has declared 10% dividend, ex-date: 19 Nov 19

No Splits history available

No Bonus history available

No Rights history available
Quality key factors
Valuation key factors
Technicals key factors
 Technical Indicator Scale: Bearish, Mildly Bearish, Sideways, Mildly Bullish, Bullish Turned
 Shareholding Snapshot : Mar 2026
Shareholding Compare (%holding)
Promoters
None
Held by 1 Schemes (0.0%)
Held by 23 FIIs (2.59%)
Bcp V Multiple Holdings Pte Ltd. (55.98%)
Florintree Tecserv Llp (6.73%)
12.29%
Quarterly Results Snapshot (Consolidated) - Mar'26 - QoQ

QoQ Growth in quarter ended Mar 2026 is 0.08% vs -2.85% in Dec 2025

QoQ Growth in quarter ended Mar 2026 is -5,207.59% vs -20.88% in Dec 2025
Half Yearly Results Snapshot (Consolidated) - Sep'25
Growth in half year ended Sep 2025 is 6.33% vs 38.88% in Sep 2024
Growth in half year ended Sep 2025 is 882.28% vs -11.13% in Sep 2024
Nine Monthly Results Snapshot (Consolidated) - Dec'25
YoY Growth in nine months ended Dec 2025 is 1.44% vs 44.85% in Dec 2024
YoY Growth in nine months ended Dec 2025 is 569.24% vs 4.67% in Dec 2024
Annual Results Snapshot (Consolidated) - Mar'26
YoY Growth in year ended Mar 2026 is -0.79% vs 27.31% in Mar 2025
YoY Growth in year ended Mar 2026 is 16.54% vs 4.04% in Mar 2025
About Indostar Capital Finance Ltd

Company Coordinates


