
Compare Indowind Energy with Similar Stocks
Dashboard
With a Operating Losses, the company has a Weak Long Term Fundamental Strength
- Company's ability to service its debt is weak with a poor EBIT to Interest (avg) ratio of 1.94
Negative results in Mar 26
With ROE of 0.2, it has a Very Expensive valuation with a 0.5 Price to Book Value
25.26% of Promoter Shares are Pledged
Underperformed the market in the last 1 year
Total Returns (Price + Dividend) 
Indowind Energy for the last several years.
Risk Adjusted Returns v/s
Returns Beta

News

Indowind Energy Ltd is Rated Strong Sell
Indowind Energy Ltd is rated Strong Sell by MarketsMOJO. This rating was last updated on 30 January 2026, reflecting a significant reassessment of the stock’s outlook. However, the analysis and financial metrics discussed below are based on the company’s current position as of 15 June 2026, providing investors with the latest insights into its performance and valuation.
Read full news article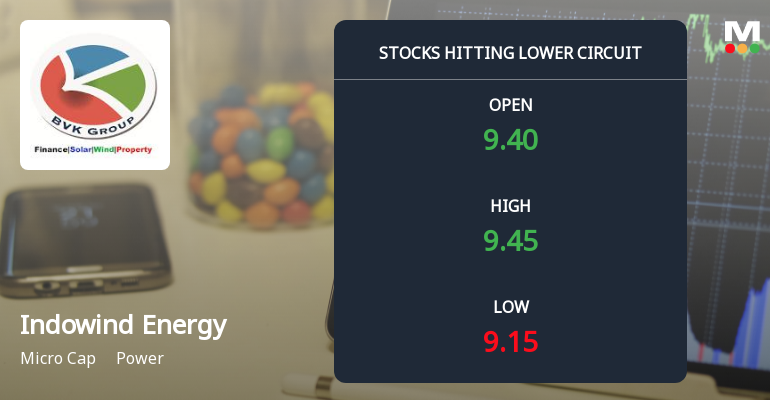
Indowind Energy Ltd Locks at Lower Circuit With 5% Loss — Sellers Queue, No Buyers in Sight
At Rs 8.94, sellers were still queuing — but there were no buyers willing to take the other side. Indowind Energy Ltd locked at its lower circuit of 5% on 8 Jun 2026, with unfilled sell orders and a frozen price, signalling persistent selling pressure in a thinly traded micro-cap stock.
Read full news article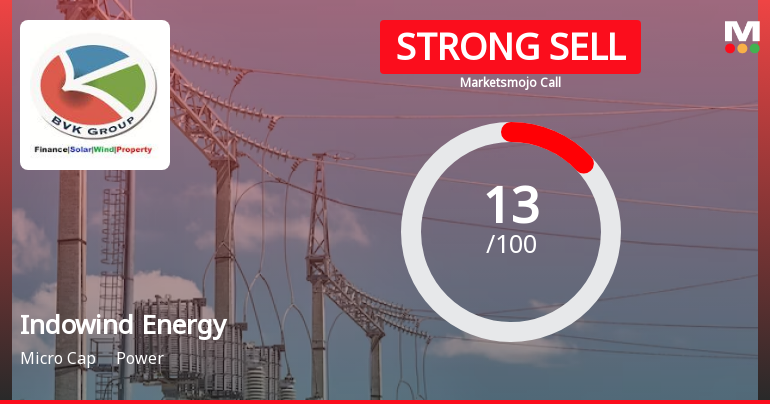
Indowind Energy Ltd is Rated Strong Sell
Indowind Energy Ltd is rated Strong Sell by MarketsMOJO, with this rating last updated on 30 January 2026. However, the analysis and financial metrics discussed below reflect the stock’s current position as of 31 May 2026, providing investors with an up-to-date view of the company’s fundamentals, valuation, financial trends, and technical outlook.
Read full news article Announcements
Compliances-Reg.24(A)-Annual Secretarial Compliance
28-May-2026 | Source : BSEDear sir/Madam PFA Annual Secretarial Compliance Report.
AUDITED FINANCIAL RESULTS AS ON 31.03.2026
26-May-2026 | Source : BSEDear sir/Madam PFA Audited financial Results as on 31.03.2026.
Board Meeting Outcome for OUTCOME OF BOARD MEETING HELD ON 26.05.2026
26-May-2026 | Source : BSEDear sir/Madam PFA outcome of Board Meeting held on 26th May 2026.
Corporate Actions

No Upcoming Board Meetings

No Dividend history available

No Splits history available

No Bonus history available

Indowind Energy Ltd has announced 1:4 rights issue, ex-date: 19 Nov 25
Quality key factors
Valuation key factors
Technicals key factors
 Technical Indicator Scale: Bearish, Mildly Bearish, Sideways, Mildly Bullish, Bullish Turned
 Shareholding Snapshot : Mar 2026
Shareholding Compare (%holding)
Non Institution
25.2585
Held by 0 Schemes
Held by 2 FIIs (0.0%)
Soura Capital Private Limited (12.2%)
Commendam Investments Private Limited (1.55%)
44.6%
Quarterly Results Snapshot (Consolidated) - Mar'26 - YoY

YoY Growth in quarter ended Mar 2026 is -20.51% vs 49.32% in Mar 2025

YoY Growth in quarter ended Mar 2026 is -71.89% vs -767.69% in Mar 2025
Half Yearly Results Snapshot (Consolidated) - Sep'25
Growth in half year ended Sep 2025 is 25.60% vs -9.32% in Sep 2024
Growth in half year ended Sep 2025 is 17.14% vs -8.10% in Sep 2024
Nine Monthly Results Snapshot (Consolidated) - Dec'25
YoY Growth in nine months ended Dec 2025 is 22.84% vs -18.57% in Dec 2024
YoY Growth in nine months ended Dec 2025 is 23.71% vs -8.91% in Dec 2024
Annual Results Snapshot (Consolidated) - Mar'26
YoY Growth in year ended Mar 2026 is 13.80% vs -9.82% in Mar 2025
YoY Growth in year ended Mar 2026 is -100.00% vs -76.58% in Mar 2025
About Indowind Energy Ltd

Company Coordinates


