
Compare Indsil Hydro with Similar Stocks
Dashboard
Low ability to service debt as the company has a high Debt to EBITDA ratio of -63.16 times
- Low ability to service debt as the company has a high Debt to EBITDA ratio of -63.16 times
- The company has been able to generate a Return on Capital Employed (avg) of 3.84% signifying low profitability per unit of total capital (equity and debt)
Poor long term growth as Operating profit has grown by an annual rate 17.87% of over the last 5 years
With ROE of 1.4, it has a Expensive valuation with a 0.6 Price to Book Value
Underperformed the market in the last 1 year
Total Returns (Price + Dividend) 
Latest dividend: 0.5 per share ex-dividend date: Sep-04-2025
Risk Adjusted Returns v/s
Returns Beta

News
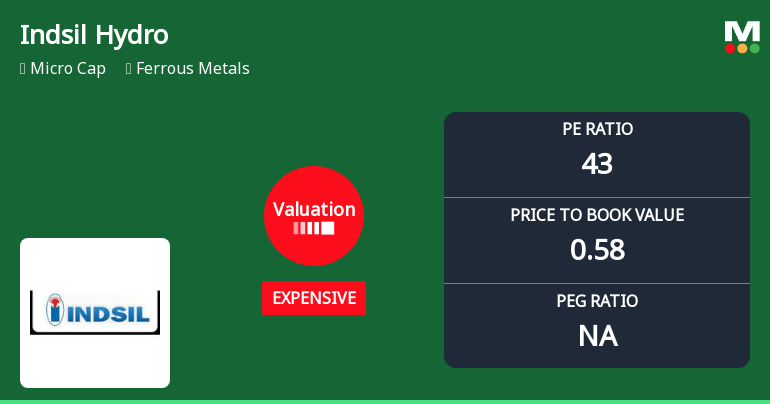
Indsil Hydro Power & Manganese Ltd Valuation Shifts Signal Price Attractiveness Change
Indsil Hydro Power & Manganese Ltd has experienced a notable shift in its valuation parameters, moving from a fair to an expensive rating, reflecting a change in price attractiveness amid mixed financial metrics and peer comparisons within the ferrous metals sector.
Read full news article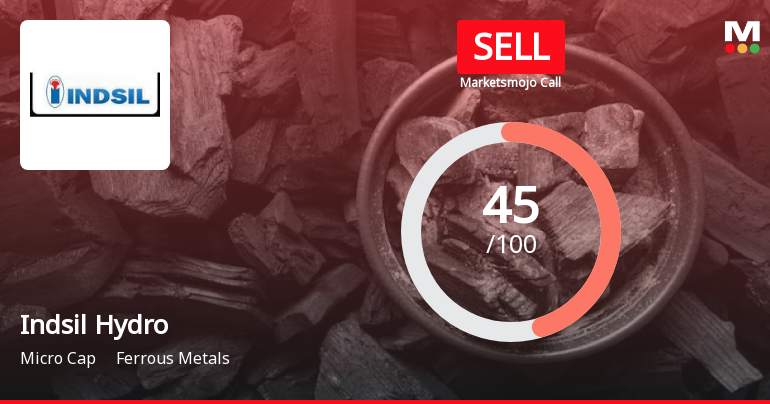
Indsil Hydro Power & Manganese Ltd is Rated Sell
Indsil Hydro Power & Manganese Ltd is rated 'Sell' by MarketsMOJO, with this rating last updated on 26 May 2026. However, the analysis and financial metrics discussed here reflect the stock's current position as of 16 June 2026, providing investors with the latest insights into the company’s performance and outlook.
Read full news article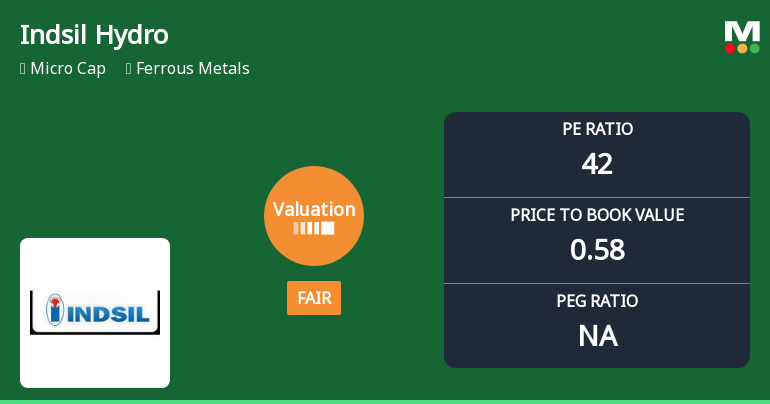
Indsil Hydro Power & Manganese Ltd: Valuation Shifts Signal Improved Price Attractiveness
Indsil Hydro Power & Manganese Ltd has witnessed a notable shift in its valuation parameters, moving from an expensive to a fair valuation grade. This change, coupled with its current price metrics and sector comparisons, suggests a recalibration of price attractiveness for investors in the ferrous metals space.
Read full news article Announcements
Announcement under Regulation 30 (LODR)-Newspaper Publication
11-Jun-2026 | Source : BSEWe enclose herewith the copies of newspaper published today
Compliances-Reg.24(A)-Annual Secretarial Compliance
30-May-2026 | Source : BSEWe enclose herewith the Secretarial Compliance Report for the financial year ended March 31 2026.
Announcement under Regulation 30 (LODR)-Newspaper Publication
27-May-2026 | Source : BSEWe enclose herewith the copies of the newspaper advertisement published by the Company in Business Standard and Makkal Kural newspapers on May 27 2026 for declaration of the Audited Financial Results (Standalone and Consolidated) of the Company for the quarter and year ended March 31 2026.
Corporate Actions

No Upcoming Board Meetings

Indsil Hydro Power & Manganese Ltd has declared 5% dividend, ex-date: 04 Sep 25

No Splits history available

Indsil Hydro Power & Manganese Ltd has announced 2:3 bonus issue, ex-date: 15 Oct 10

No Rights history available
Quality key factors
Valuation key factors
Technicals key factors
 Technical Indicator Scale: Bearish, Mildly Bearish, Sideways, Mildly Bullish, Bullish Turned
 Shareholding Snapshot : Mar 2026
Shareholding Compare (%holding)
Promoters
None
Held by 0 Schemes
Held by 0 FIIs
Sunmet Holdings India Private Limited (49.95%)
Kerala State Industrial Development Corporation (3.79%)
28.1%
Quarterly Results Snapshot (Standalone) - Mar'26 - YoY

YoY Growth in quarter ended Mar 2026 is 17.73% vs 6.61% in Mar 2025
YoY Growth in quarter ended Mar 2026 is 104.32% vs -28,155.56% in Mar 2025
Half Yearly Results Snapshot (Standalone) - Sep'25
Growth in half year ended Sep 2025 is 26.52% vs -7.69% in Sep 2024

Growth in half year ended Sep 2025 is -89.83% vs 1,106.33% in Sep 2024
Nine Monthly Results Snapshot (Standalone) - Dec'25
YoY Growth in nine months ended Dec 2025 is 19.14% vs 10.35% in Dec 2024
YoY Growth in nine months ended Dec 2025 is -86.27% vs 1,219.67% in Dec 2024
Annual Results Snapshot (Consolidated) - Mar'26
YoY Growth in year ended Mar 2026 is 29.94% vs -34.05% in Mar 2024
YoY Growth in year ended Mar 2026 is 250.60% vs -10.18% in Mar 2024
About Indsil Hydro Power & Manganese Ltd

Company Coordinates


