
Compare Inducto Steel with Similar Stocks
Stock DNA
Iron & Steel Products
INR 20 Cr (Micro Cap)
38.00
23
0.00%
-0.30
1.32%
0.51
Total Returns (Price + Dividend) 
Latest dividend: 3.5000000000000004 per share ex-dividend date: Sep-18-2013
Risk Adjusted Returns v/s
Returns Beta

News
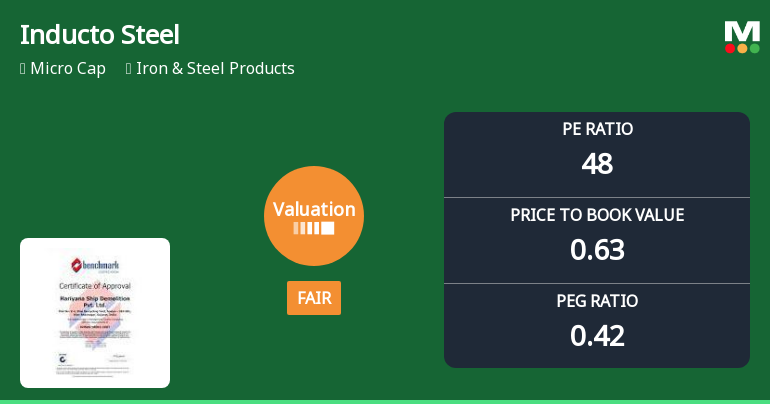
Inducto Steel Ltd Valuation Shifts Signal Changing Market Sentiment
Inducto Steel Ltd, a micro-cap player in the Iron & Steel Products sector, has witnessed a notable shift in its valuation parameters, moving from an attractive to a fair rating. This change comes amid a strong rally in its stock price, which has surged 8.5% in a single day and outperformed the Sensex significantly over multiple time frames. However, despite the recent gains, the company’s valuation metrics now suggest a more tempered price attractiveness compared to its historical and peer averages.
Read full news article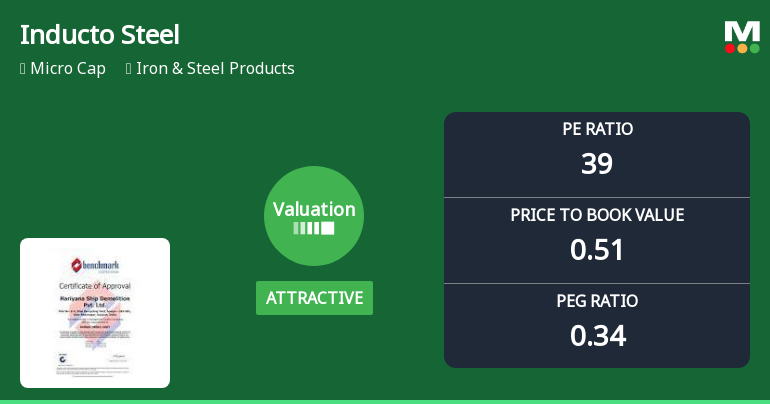
Inducto Steel Ltd Valuation Shifts Signal Renewed Price Attractiveness Amid Mixed Returns
Inducto Steel Ltd, a micro-cap player in the Iron & Steel Products sector, has witnessed a notable shift in its valuation parameters, moving from a fair to an attractive valuation grade. Despite a recent day decline of 6.41%, the company’s price-to-earnings (P/E) and price-to-book value (P/BV) ratios suggest a compelling investment case relative to its historical averages and peer group, even as its MarketsMOJO Mojo Grade remains a Sell with a recent upgrade from Strong Sell.
Read full news article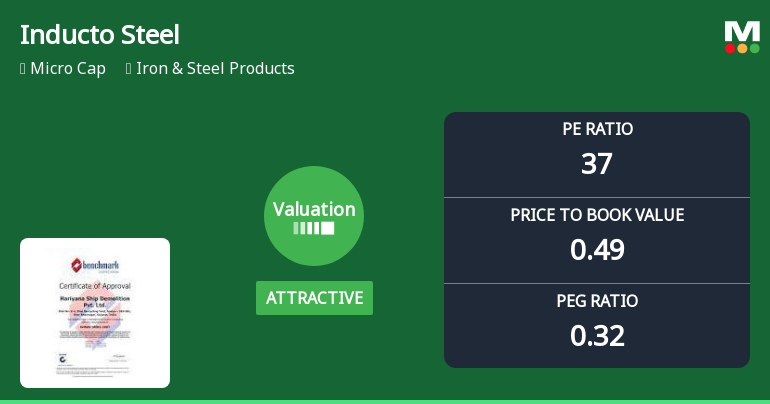
Inducto Steel Ltd Valuation Shifts Signal Renewed Price Attractiveness Amid Market Volatility
Inducto Steel Ltd has witnessed a notable shift in its valuation parameters, moving from a fair to an attractive rating, despite ongoing market headwinds and a recent downgrade in its Mojo Grade. This article analyses the company’s current price-to-earnings (P/E) and price-to-book value (P/BV) ratios in comparison to historical averages and peer benchmarks, providing investors with a comprehensive view of its price attractiveness and investment potential.
Read full news article Announcements
Compliances-Certificate under Reg. 74 (5) of SEBI (DP) Regulations 2018
15-Jul-2026 | Source : BSEEnclosed herewith the certificate dated July 1 2026 issued by Registrar and Share Transfer Agent confirming compliance under Regulation 74(5) SEBI (Depositories and Participants) Regulations 2018 for the quarter ended June 2026.
Closure of Trading Window
25-Jun-2026 | Source : BSEPursuant to SEBI (Prohibition of Insider Trading) Regulation 2015 and in accordance with Code of Conduct for Trading in Listed or Proposed to be Listed Securities of Inducto Steel Limited please note that the Trading Window for dealing in securities of the Company shall remain closed for all Designated Persons (as defined in the code) with effect from Wednesday July 01 2026. The Trading Window shall open 48 hours after the Companys unaudited Standalone and Consolidated Financial Results for the quarter ended June 30 2026 becomes generally available.
Board Meeting Outcome for Outcome Of The Meeting Of The Board Of Directors Of Inducto Steel Limited (The Company) Held On May 29 2026.
29-May-2026 | Source : BSEThe Board of Directors of the Company has in its Meeting held today i.e. on Friday May 29 2026 inter alia considered and approved the following: 1. Audited Standalone and Consolidated Financial Results of the Company for quarter and year ended March 31 2026 alongwith the Auditors Report for the quarter and year ended March 31 2026. 2. Appointment of Cost Auditor of the company for the Financial year 2026-2027. 3. Appointment of Internal Auditor of the company for the Financial year 2026-2027.
Corporate Actions

No Upcoming Board Meetings

Inducto Steel Ltd has declared 35% dividend, ex-date: 18 Sep 13

No Splits history available

No Bonus history available

No Rights history available
Quality key factors
Valuation key factors
Technicals key factors
 Technical Indicator Scale: Bearish, Mildly Bearish, Sideways, Mildly Bullish, Bullish Turned
 Shareholding Snapshot : Mar 2026
Shareholding Compare (%holding)
Promoters
43.2773
Held by 0 Schemes
Held by 0 FIIs
Rakesh Shantisarup Reniwal (37.09%)
Babita Sandip Agarwal (5.06%)
26.9%
Quarterly Results Snapshot (Consolidated) - Mar'26 - QoQ

QoQ Growth in quarter ended Mar 2026 is 94.77% vs 53.27% in Dec 2025
QoQ Growth in quarter ended Mar 2026 is 892.86% vs 118.67% in Dec 2025
Half Yearly Results Snapshot (Consolidated) - Sep'25

Growth in half year ended Sep 2025 is -20.31% vs 38.86% in Sep 2024
Growth in half year ended Sep 2025 is 68.87% vs -1,614.29% in Sep 2024
Nine Monthly Results Snapshot (Consolidated) - Dec'25
YoY Growth in nine months ended Dec 2025 is -14.80% vs 42.09% in Dec 2024
YoY Growth in nine months ended Dec 2025 is 77.45% vs -1,242.42% in Dec 2024
Annual Results Snapshot (Consolidated) - Mar'26
YoY Growth in year ended Mar 2026 is 4.50% vs 52.40% in Mar 2025
YoY Growth in year ended Mar 2026 is 114.52% vs -2,425.00% in Mar 2025
About Inducto Steel Ltd

Company Coordinates


