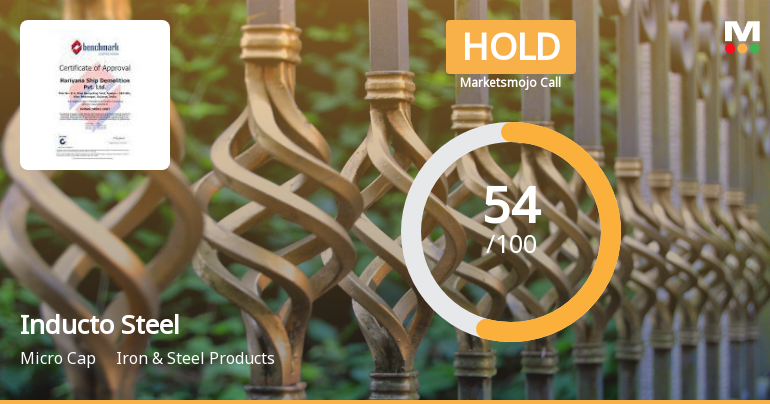
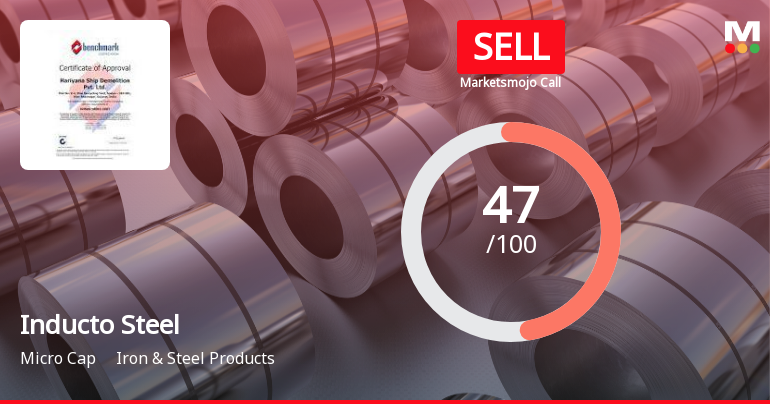
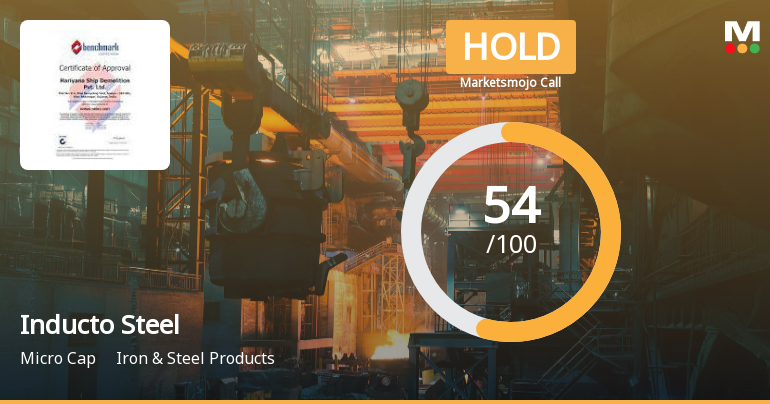
Inducto Steel

  • Market Cap: Micro Cap
  • Industry: Iron & Steel Products
  • ISIN: INE146H01018
  • NSEID:
  • BSEID: 532001
INR
60.30
1.49 (2.53%)
BSENSE

Sep 25, 03:30 PM

BSE+NSE Vol: 524

  • Price Points
  • Score
  • Mojo Parameters
  • Total Return
  • News and Corporate Actions
  • Key factors
  • Shareholding
  • Financials
  • CompanyCV
stock-summaryPrice Point
High/Low

1Day

52 Week

Valuation
Technical
Day's Volume

CASH

524 (192.74%) Volume

Shareholding (Jun 2026)

FII

0.00%

Held by 0 FIIs

DII

0.00%

Held by 0 DIIs

Promoter

69.32%

Why is Inducto Steel Ltd falling/rising?

06-Sep-2026

As of 05-Sep, Inducto Steel Ltd's stock price is rising to Rs 66.44, up 5.61%, supported by strong performance metrics and positive trading momentum despite a significant decline in investor participation. The stock has outperformed the Sensex over various periods, indicating a bullish trend.

As of 05-Sep, Inducto Steel Ltd's stock price is rising, currently at Rs 66.44, reflecting an increase of Rs 3.53 or 5.61%. This upward movement is supported by strong performance metrics over various time periods. For instance, the stock has outperformed the benchmark Sensex, showing a 1-week increase of 3.80% compared to the Sensex's decline of 0.97%, and a remarkable 1-month rise of 27.77% against a 2.44% drop in the Sensex. Year-to-date, the stock has surged by 44.34%, while the Sensex has fallen by 10.21%.<BR><BR>Today's trading activity also indicates positive momentum, with the stock reaching an intraday high of Rs 67.49, marking a 7.28% increase. Furthermore, Inducto Steel is trading above its moving averages across multiple time frames, including the 5-day, 20-day, 50-day, 100-day, and 200-day averages, which typically signals a bullish trend. <BR><BR>However, it is worth noting that there has been a significant decline in investor participation, with delivery volume dropping by 85.43% against the 5-day average. Despite this, the stock remains liquid enough for trading, indicating that the current price rise is primarily driven by positive performance metrics rather than high trading volumes. Overall, the combination of strong returns relative to the benchmark and favorable moving averages contributes to the rising stock price of Inducto Steel Ltd.

View full answer

Should I buy, sell or hold Inducto Steel Ltd?

02-Sep-2026

Who are in the management team of Inducto Steel?

01-Sep-2026

The management team of Inducto Steel includes Rajeev Shantisarup Reniwal (Chairman & Managing Director), Sweety Rajeev Reniwal (Director), Yogesh Anantrai Thakkar (Independent Director), Bhushanlal Behl (Independent Director), and Fulvanti Jain (Company Secretary & Compliance Officer).

The management team of Inducto Steel includes the following individuals:<BR><BR>1. **Rajeev Shantisarup Reniwal** - Chairman & Managing Director<BR>2. **Sweety Rajeev Reniwal** - Director<BR>3. **Yogesh Anantrai Thakkar** - Independent Director<BR>4. **Bhushanlal Behl** - Independent Director<BR>5. **Fulvanti Jain** - Company Secretary & Compliance Officer<BR><BR>If you have any more questions about the company or its operations, feel free to ask!

View full answer

What does Inducto Steel do?

01-Sep-2026

Inducto Steel Ltd is a diversified company involved in ship breaking and trading metal scrap, coal, and aluminum foil, classified as a Micro Cap. As of June 2026, it reported net sales of 79 Cr and a net profit of 1 Cr.

Overview:<BR>Inducto Steel Ltd is a diversified company engaged in ship breaking activities and trading in metal scrap, coal, aluminum foil, and other inputs, operating within the Iron & Steel Products industry and classified as a Micro Cap.<BR><BR>History:<BR>Inducto Steel Ltd was incorporated in November 1988 in the State of Gujarat. The company has undergone status changes, particularly in 1996-97 when production was affected by a fire at its plant. The latest quarterly results reported net sales and net profit for June 2026.<BR><BR>Financial Snapshot:<BR>Net Sales: 79 Cr (Quarterly Results - Jun 2026) <BR>Net Profit: 1 Cr (Quarterly Results - Jun 2026) <BR>Market Cap: INR 27 Cr (Micro Cap)<BR><BR>Key Metrics:<BR>P/E: 13.00 <BR>Industry P/E: 21 <BR>Dividend Yield: 0.00% <BR>Debt Equity: -0.30 <BR>Return on Equity: 1.32% <BR>Price to Book: 0.64 <BR><BR>Contact Details:<BR>Address: 156 Maker Chambers VI 220, Jamnalal Bajaj Marg NarimanPoi Mumbai Maharashtra : 400021 <BR>Tel: 91-22-22043211 <BR>Fax: 91-22-22043215 <BR>Email: contact@hariyanagroup.com <BR>Website: http://www.hariyanagroup.com

View full answer

Who are the peers of the Inducto Steel?

01-Sep-2026

Inducto Steel's peers include Ashirwad Steels, Natl. Gen. Inds., Rathi Bars, Unison Metals, Rish.Digh.Steel, Bloom Industries, and Kalana Ispat. Inducto Steel has a good growth rating and a 1-year return of 13.17%, outperforming Natl. Gen. Inds. (9.19%) and Rathi Bars (-46.68%).

Peers: The peers of Inducto Steel are Ashirwad Steels, Natl. Gen. Inds., Rathi Bars, Unison Metals, Rish.Digh.Steel, Bloom Industries, and Kalana Ispat.<BR><BR>Quality Snapshot: Average management risk is observed at Ashirwad Steels and Rish.Digh.Steel, while Below Average management risk is found at Natl. Gen. Inds., Inducto Steel, Rathi Bars, Unison Metals, Bloom Industries, and Kalana Ispat. Growth is rated as Good for Inducto Steel, while Below Average growth is noted for Ashirwad Steels, Natl. Gen. Inds., Rathi Bars, Unison Metals, Rish.Digh.Steel, and Kalana Ispat, with Bloom Industries showing Average growth. Capital Structure is rated as Below Average for Ashirwad Steels, Natl. Gen. Inds., Inducto Steel, Rathi Bars, Unison Metals, Rish.Digh.Steel, and Bloom Industries, while Kalana Ispat has an Average capital structure.<BR><BR>Return Snapshot: The peer with the highest 1-year return is Natl. Gen. Inds. at 9.19%, while Rathi Bars has the lowest at -46.68%. Inducto Steel's 1-year return is 13.17%, which is higher than Natl. Gen. Inds. and significantly higher than Rathi Bars. Additionally, Unison Metals, Rathi Bars, and Bloom Industries have negative six-month returns.

View full answer

How big is Inducto Steel?

01-Sep-2026

As of 31st August, Inducto Steel Ltd has a market capitalization of 27.00 Cr, with recent net sales of 199.23 Cr and a net profit of 2.07 Cr. Shareholder's funds are 39.49 Cr and total assets amount to 55.82 Cr as of March 2025.

As of 31st August, Inducto Steel Ltd has a market capitalization of 27.00 Cr, categorizing it as a Micro Cap company.<BR><BR>In the latest 4 quarters, Inducto Steel reported Net Sales of 199.23 Cr and a Net Profit of 2.07 Cr.<BR><BR>The latest annual period for the balance sheet is March 2025, with Shareholder's Funds amounting to 39.49 Cr and Total Assets of 55.82 Cr.

View full answer

When is the next results date for Inducto Steel Ltd?

31-Jul-2026

The next results date for Inducto Steel Ltd is 12 August 2026.

The next results date for Inducto Steel Ltd is scheduled for 12 August 2026.

View full answer

Are Inducto Steel Ltd latest results good or bad?

30-May-2026

Inducto Steel Ltd's latest Q4 FY26 results show a significant improvement with a net profit of ₹1.39 crore and a 94.77% revenue increase, indicating a positive turnaround. However, ongoing financial challenges and a net loss for FY25 suggest caution is warranted despite the recent gains.

Inducto Steel Ltd's latest results for Q4 FY26 show a significant improvement compared to previous quarters, indicating a positive turnaround. The company reported a net profit of ₹1.39 crore, which is an impressive 892.86% increase quarter-on-quarter. Revenue also surged to ₹64.84 crore, reflecting a 94.77% increase from the previous quarter. Additionally, the operating margin improved to 4.12%, the highest in eight quarters.<BR><BR>However, while these quarterly results are encouraging, they come after two consecutive loss-making quarters, and the overall financial picture for FY25 remains concerning. The company reported a net loss of ₹3.00 crore for the full year, despite a revenue increase of 51.90%. This highlights ongoing challenges in achieving consistent profitability.<BR><BR>Moreover, the company faces issues such as weak return on equity, high levels of share pledging, and negative cash flows, which raise red flags about its financial health. The stock has also underperformed compared to its peers and the broader market over the past year.<BR><BR>In summary, while the latest quarterly results are good and indicate a recovery, the broader context of financial instability and past performance suggests that caution is warranted.

View full answer

Is Inducto Steel overvalued or undervalued?

17-Nov-2025

As of November 14, 2025, Inducto Steel is considered undervalued and attractive despite its negative PE ratio of -15.42, especially when compared to peers like Elitecon International and PTC India, indicating potential for recovery and future appreciation despite recent underperformance against the Sensex.

As of 14 November 2025, the valuation grade for Inducto Steel has moved from risky to attractive, indicating a significant improvement in its perceived value. The company is currently considered undervalued, especially when compared to its peers. Key ratios include a PE ratio of -15.42, an EV to EBITDA ratio of 39.69, and a Price to Book Value of 0.60, which highlight its current financial challenges but also suggest potential for recovery.<BR><BR>In comparison to its peers, Inducto Steel's valuation stands out; for instance, Elitecon International is categorized as very expensive with a PE ratio of 309.88, while PTC India, deemed very attractive, has a PE ratio of 7.52. This context reinforces the notion that Inducto Steel may be undervalued given its attractive rating despite its negative earnings. Additionally, while the stock has underperformed against the Sensex in the short term, it has shown substantial growth over longer periods, suggesting potential for future appreciation.

View full answer

How has been the historical performance of Inducto Steel?

14-Nov-2025

Inducto Steel has experienced significant revenue growth from INR 2.93 crore in Mar'21 to INR 158.57 crore in Mar'25, but it faces challenges with rising expenditures, resulting in operating losses and negative profitability, with a profit after tax of INR -3.72 crore in Mar'25. The company also reported negative cash flow from operations at INR -11.00 crore for the same period.

Answer:<BR>The historical performance of Inducto Steel shows significant fluctuations in revenue and profitability over the years. <BR><BR>Breakdown:<BR>Inducto Steel's net sales have seen a substantial increase from INR 2.93 crore in Mar'21 to INR 158.57 crore in Mar'25, reflecting a strong growth trajectory. However, the total expenditure has also risen sharply, reaching INR 161.11 crore in Mar'25, which has led to an operating loss of INR -2.54 crore for the same period. The company reported a profit before tax of INR -4.68 crore in Mar'25, down from a profit of INR 0.26 crore in Mar'24, indicating a decline in profitability. The profit after tax also turned negative at INR -3.72 crore in Mar'25, compared to a profit of INR 0.16 crore in the previous year. The total assets of Inducto Steel stood at INR 55.82 crore in Mar'25, while total liabilities increased to INR 55.82 crore, resulting in a net current asset position of INR 9.96 crore. The cash flow from operating activities was negative at INR -11.00 crore in Mar'25, reflecting challenges in generating cash from core operations. Overall, while revenue growth is evident, the company faces significant challenges in managing costs and achieving profitability.

View full answer

Who are the top shareholders of the Inducto Steel?

17-Jul-2025

The top shareholders of Inducto Steel include Rakesh Shantisarup Reniwal with 37.09%, followed by public shareholder Babita Sandip Agarwal at 5.06%, while individual investors collectively hold 26.5%. There are currently no mutual funds or foreign institutional investors holding shares in the company.

The top shareholders of Inducto Steel primarily include the promoters, with Rakesh Shantisarup Reniwal holding the largest share at 37.09%. Additionally, the highest public shareholder is Babita Sandip Agarwal, who owns 5.06%. It's also noteworthy that individual investors collectively hold 26.5% of the shares. Currently, there are no mutual funds or foreign institutional investors (FIIs) holding shares in the company.

View full answer

What is the technical trend for Inducto Steel?

09-Jun-2025

As of June 4, 2025, Inducto Steel's technical trend is mildly bullish, supported by a bullish weekly MACD and Bollinger Bands, although caution is advised due to a mildly bearish monthly MACD and daily moving averages indicating short-term weakness.

As of 4 June 2025, the technical trend for Inducto Steel has changed from mildly bearish to mildly bullish. The weekly MACD is bullish, supporting the positive shift, while the monthly MACD remains mildly bearish, indicating some caution. The Bollinger Bands are bullish on both weekly and monthly time frames, reinforcing the upward momentum. The Dow Theory shows a mildly bullish stance on both weekly and monthly charts. However, the daily moving averages are mildly bearish, suggesting short-term weakness. Overall, the current technical stance is mildly bullish, driven primarily by the weekly MACD and Bollinger Bands, despite some mixed signals from other indicators.

View full answer

Has Inducto Steel declared dividend?

06-Jun-2025

Inducto Steel Ltd has declared a 35% dividend, amounting to 3.5 per share, with an ex-date of September 18, 2013. However, the dividend yield is 0%, as dividends have not contributed to total returns, which have been driven solely by significant price appreciation over the years.

Inducto Steel Ltd has declared a 35% dividend.<BR><BR>Dividend Details:<BR>- Percentage announced: 35%<BR>- Amount per share: 3.5<BR>- Ex-date: 18 Sep 13<BR><BR>Dividend Yield: 0%<BR><BR>Total Returns by Period:<BR>In the 6-month period, the price return was 20.57%, the dividend return was 0%, resulting in a total return of 20.57%.<BR><BR>For the 1-year period, the price return was 43.84%, the dividend return was 0%, leading to a total return of 43.84%.<BR><BR>Over the 2-year period, the price return was 149.21%, with a dividend return of 0%, culminating in a total return of 149.21%.<BR><BR>In the 3-year period, the price return was 111.31%, the dividend return was 0%, resulting in a total return of 111.31%.<BR><BR>For the 4-year period, the price return was 285.84%, with a dividend return of 0%, leading to a total return of 285.84%.<BR><BR>In the 5-year period, the price return was 472.16%, the dividend return was 0%, culminating in a total return of 472.16%.<BR><BR>Overall, Inducto Steel Ltd has declared a dividend, but the dividend yield remains at 0%, indicating that while the company has provided dividends, the returns from dividends have not contributed to the overall return in recent periods. The total returns over the years show significant price appreciation, reflecting strong performance in the stock price.

View full answer
iScoreScore

Dashboard

1

Weak Long Term Fundamental Strength with an average Return on Capital Employed (ROCE) of 4.67%

  • Company's ability to service its debt is weak with a poor EBIT to Interest (avg) ratio of 0.33
2

Positive results in Jun 26

3

With ROE of 1.3, it has a Fair valuation with a 0.6 Price to Book Value

4

43.28% of Promoter Shares are Pledged

5

Underperformed the market in the last 1 year

stock-summaryMojo Parameters

Mojo Parameters

Loading Valuation Snapshot...

Stock DNA

stock-summary
Industry

Iron & Steel Products

stock-summary
Market cap

INR 24 Cr (Micro Cap)

stock-summary
P/E

12.00

stock-summary
Industry P/E

22

stock-summary
Dividend Yield

0.00%

stock-summary
Debt Equity

-0.30

stock-summary
Return on Equity

1.32%

stock-summary
Price to Book

0.60

Revenue and Profits:
Net Sales:
79 Cr
(Quarterly Results - Jun 2026)
Net Profit:
1 Cr
stock-summaryTotal Returns
Total Returns (Price + Dividend) stock-summary
Dividend Yield (0%)
TimePeriod
Price Return
Dividend Return
Total Return
3 Months
9.64%
0%
9.64%
6 Months
21.82%
0%
21.82%
1 Year
-14.0%
0%
-14.0%
2 Years
-18.51%
0%
-18.51%
3 Years
70.68%
0%
70.68%
4 Years
50.75%
0%
50.75%
5 Years
0%
0%
0.0%

Latest dividend: 3.5000000000000004 per share ex-dividend date: Sep-18-2013

Risk Adjusted Returns v/s stock-summary
Returns Beta
Icon
Beta has not been calculated since enough price history is not available
stock-summaryNews & Corporate Actions

News

Announcements stock-summary

Intimation Of Cut-Off Date And Remote E-Voting For The Purpose Of 38Th Annual General Meeting (AGM)

07-Sep-2026 | Source : BSE

We wish to inform that the remote e voting for the 38th AGM shall commence on Sunday September 27 2026 at 9.00 am and ends on Tuesday September 29 2026 at 5.00 pm. The Cut off date for deteminign the eligibility of shareholders to excercise remote e voting and e voting at AGM is Wednesday September 23 2026.

Notice Of The 38Th Annual General Meeting (AGM) Of Inducto Steel Limited

07-Sep-2026 | Source : BSE

We wish to inform that 38th Annual General Meeting of the Company is scheduled to be held on Wednesday September 30 2026 at 10.00 a.m. IST through Video-conferencing or other audio-visual means.

Reg. 34 (1) Annual Report.

07-Sep-2026 | Source : BSE

Pursuant to Regulation 34 of the Listing Regulations we enclose herewith a copy of the Annual Report along with Notice of the Annual General Meeting (AGM) for the financial year ended March 31 2026 which is also sent through electronic mode to those Members whose e-mail addresses are registered with the Company/Registrar and Transfer Agent/ Depositories. The Annual Report for the financial year 2025-26 along with Notice of the 38th AGM is uploaded on the website of the Company at www.hariyanagroup.com

Corporate Actions stock-summary

stock-summary
BOARD MEETING

No Upcoming Board Meetings

stock-summary
DIVIDEND

Inducto Steel Ltd has declared 35% dividend, ex-date: 18 Sep 13

stock-summary
SPLITS

No Splits history available

stock-summary
BONUS

No Bonus history available

stock-summary
RIGHTS

No Rights history available

stock-summaryKey Factors

Quality key factors stock-summary

Factor
Value
Sales Growth (5y)
87.18%
EBIT Growth (5y)
33.24%
EBIT to Interest (avg)
0.33
Debt to EBITDA (avg)
3.82
Net Debt to Equity (avg)
-0.30
Sales to Capital Employed (avg)
1.92
Tax Ratio
25.63%
Dividend Payout Ratio
0
Pledged Shares
43.28%
Institutional Holding
0
ROCE (avg)
12.38%
ROE (avg)
1.68%

Valuation key factors

Factor
Value
P/E Ratio
12
Industry P/E
22
Price to Book Value
0.60
EV to EBIT
1.59
EV to EBITDA
1.52
EV to Capital Employed
0.44
EV to Sales
0.06
PEG Ratio
0.07
Dividend Yield
NA
ROCE (Latest)
9.43%
ROE (Latest)
1.32%

Technicals key factors

Indicator
Weekly
Monthly
MACD
Bullish
Mildly Bullish
RSI
No Signal
No Signal
Bollinger Bands
Bullish
Mildly Bullish
Moving Averages
Bullish (Daily)
KST
Bullish
Bearish
Dow Theory
No Trend
Mildly Bullish
stock-summary Technical Indicator Scale: Bearish, Mildly Bearish, Sideways, Mildly Bullish, Bullish  Turned 
stock-summaryShareholding
Shareholding Snapshot : Jun 2026stock-summary
Shareholding Compare (%holding) stock-summary
Majority shareholders

Promoters

Pledged Promoter Holdings

43.2773

Mutual Funds

Held by 0 Schemes

FIIs

Held by 0 FIIs

Promoter with highest holding

Rakesh Shantisarup Reniwal (37.09%)

Highest Public shareholder

Babita Sandip Agarwal (5.06%)

Individual Investors Holdings

26.87%

stock-summaryFinancial
[
  {
    "link": "quarterly",
    "btn_text": "All Quarterly Results",
    "header": "Quarterly Results Snapshot (Consolidated) - Jun'26 - QoQ",
    "rhs": [
      {
        "prefix": "Net Sales ",
        "suffix": "QoQ Growth in quarter ended Jun 2026 is 22.42% vs 94.77% in Mar 2026",
        "dir": -1
      },
      {
        "prefix": "Consolidated Net Profit ",
        "suffix": "QoQ Growth in quarter ended Jun 2026 is -7.19% vs 892.86% in Mar 2026",
        "dir": -1
      }
    ],
    "table": {
      "header": [
        "Jun'26",
        "Mar'26",
        "Change(%)"
      ],
      "body": [
        {
          "field": "Net Sales",
          "val1": "79.38",
          "val2": "64.84",
          "chgp": "22.42%",
          "chgp_class": "positive"
        },
        {
          "field": "Operating Profit (PBDIT) excl Other Income",
          "val1": "5.67",
          "val2": "2.67",
          "chgp": "112.36%",
          "chgp_class": "positive"
        },
        {
          "field": "Interest",
          "val1": "4.24",
          "val2": "0.66",
          "chgp": "542.42%",
          "chgp_class": "negative"
        },
        {
          "field": "Exceptional Items",
          "val1": "0.00",
          "val2": "0.00",
          "chgp": "",
          "chgp_class": "neutral"
        },
        {
          "field": "Consolidate Net Profit",
          "val1": "1.29",
          "val2": "1.39",
          "chgp": "-7.19%",
          "chgp_class": "negative"
        },
        {
          "field": "Operating Profit Margin (Excl OI)",
          "val1": "7.14%",
          "val2": "4.12%",
          "chgp": "3.02%",
          "chgp_class": "positive"
        }
      ]
    }
  },
  {
    "link": "half-yearly",
    "btn_text": "All Half Yearly Results",
    "header": "Half Yearly Results Snapshot (Consolidated) - Sep'25",
    "rhs": [
      {
        "prefix": "Net Sales ",
        "suffix": " Growth in half year ended Sep 2025 is -20.31% vs 38.86% in Sep 2024",
        "dir": -1
      },
      {
        "prefix": "Consolidated Net Profit ",
        "suffix": " Growth in half year ended Sep 2025 is 68.87% vs -1,614.29% in Sep 2024",
        "dir": 1
      }
    ],
    "table": {
      "header": [
        "Sep'25",
        "Sep'24",
        "Change(%)"
      ],
      "body": [
        {
          "field": "Net Sales",
          "val1": "67.58",
          "val2": "84.80",
          "chgp": "-20.31%",
          "chgp_class": "negative"
        },
        {
          "field": "Operating Profit (PBDIT) excl Other Income",
          "val1": "-0.26",
          "val2": "-3.43",
          "chgp": "92.42%",
          "chgp_class": "positive"
        },
        {
          "field": "Interest",
          "val1": "1.13",
          "val2": "0.95",
          "chgp": "18.95%",
          "chgp_class": "negative"
        },
        {
          "field": "Exceptional Items",
          "val1": "0.00",
          "val2": "0.00",
          "chgp": "",
          "chgp_class": "neutral"
        },
        {
          "field": "Consolidate Net Profit",
          "val1": "-0.99",
          "val2": "-3.18",
          "chgp": "68.87%",
          "chgp_class": "positive"
        },
        {
          "field": "Operating Profit Margin (Excl OI)",
          "val1": "-0.38%",
          "val2": "-4.04%",
          "chgp": "3.66%",
          "chgp_class": "positive"
        }
      ]
    }
  },
  {
    "link": "nine-monthly",
    "btn_text": "All Nine Monthly Results",
    "header": "Nine Monthly Results Snapshot (Consolidated) - Dec'25",
    "rhs": [
      {
        "prefix": "Net Sales ",
        "suffix": "YoY Growth in nine months ended Dec 2025 is -14.80% vs 42.09% in Dec 2024",
        "dir": -1
      },
      {
        "prefix": "Consolidated Net Profit ",
        "suffix": "YoY Growth in nine months ended Dec 2025 is 77.45% vs -1,242.42% in Dec 2024",
        "dir": 1
      }
    ],
    "table": {
      "header": [
        "Dec'25",
        "Dec'24",
        "Change(%)"
      ],
      "body": [
        {
          "field": "Net Sales",
          "val1": "100.87",
          "val2": "118.39",
          "chgp": "-14.80%",
          "chgp_class": "negative"
        },
        {
          "field": "Operating Profit (PBDIT) excl Other Income",
          "val1": "0.35",
          "val2": "-3.49",
          "chgp": "110.03%",
          "chgp_class": "positive"
        },
        {
          "field": "Interest",
          "val1": "1.75",
          "val2": "1.84",
          "chgp": "-4.89%",
          "chgp_class": "positive"
        },
        {
          "field": "Exceptional Items",
          "val1": "0.00",
          "val2": "0.00",
          "chgp": "",
          "chgp_class": "neutral"
        },
        {
          "field": "Consolidate Net Profit",
          "val1": "-0.85",
          "val2": "-3.77",
          "chgp": "77.45%",
          "chgp_class": "positive"
        },
        {
          "field": "Operating Profit Margin (Excl OI)",
          "val1": "0.35%",
          "val2": "-2.95%",
          "chgp": "3.30%",
          "chgp_class": "positive"
        }
      ]
    }
  },
  {
    "link": "annual",
    "btn_text": "All Annual Results",
    "header": "Annual Results Snapshot (Consolidated) - Mar'26",
    "rhs": [
      {
        "prefix": "Net Sales ",
        "suffix": "YoY Growth in year ended Mar 2026 is 4.50% vs 52.40% in Mar 2025",
        "dir": -1
      },
      {
        "prefix": "Consolidated Net Profit ",
        "suffix": "YoY Growth in year ended Mar 2026 is 114.52% vs -2,425.00% in Mar 2025",
        "dir": 1
      }
    ],
    "table": {
      "header": [
        "Mar'26",
        "Mar'25",
        "Change(%)"
      ],
      "body": [
        {
          "field": "Net Sales",
          "val1": "165.71",
          "val2": "158.57",
          "chgp": "4.50%",
          "chgp_class": "positive"
        },
        {
          "field": "Operating Profit (PBDIT) excl Other Income",
          "val1": "3.03",
          "val2": "-2.54",
          "chgp": "219.29%",
          "chgp_class": "positive"
        },
        {
          "field": "Interest",
          "val1": "2.41",
          "val2": "2.17",
          "chgp": "11.06%",
          "chgp_class": "negative"
        },
        {
          "field": "Exceptional Items",
          "val1": "0.00",
          "val2": "0.00",
          "chgp": "",
          "chgp_class": "neutral"
        },
        {
          "field": "Consolidate Net Profit",
          "val1": "0.54",
          "val2": "-3.72",
          "chgp": "114.52%",
          "chgp_class": "positive"
        },
        {
          "field": "Operating Profit Margin (Excl OI)",
          "val1": "1.83%",
          "val2": "-1.60%",
          "chgp": "3.43%",
          "chgp_class": "positive"
        }
      ]
    }
  }
]

Quarterly Results Snapshot (Consolidated) - Jun'26 - QoQstock-summary

Jun'26
Mar'26
Change(%)
Net Sales
79.38
64.84
22.42%
Operating Profit (PBDIT) excl Other Income
5.67
2.67
112.36%
Interest
4.24
0.66
542.42%
Exceptional Items
0.00
0.00
Consolidate Net Profit
1.29
1.39
-7.19%
Operating Profit Margin (Excl OI)
7.14%
4.12%
3.02%
Values in Rs Cr.
Direction Arrows
Net Sales

QoQ Growth in quarter ended Jun 2026 is 22.42% vs 94.77% in Mar 2026

Direction Arrows
Consolidated Net Profit

QoQ Growth in quarter ended Jun 2026 is -7.19% vs 892.86% in Mar 2026

Half Yearly Results Snapshot (Consolidated) - Sep'25stock-summary

Sep'25
Sep'24
Change(%)
Net Sales
67.58
84.80
-20.31%
Operating Profit (PBDIT) excl Other Income
-0.26
-3.43
92.42%
Interest
1.13
0.95
18.95%
Exceptional Items
0.00
0.00
Consolidate Net Profit
-0.99
-3.18
68.87%
Operating Profit Margin (Excl OI)
-0.38%
-4.04%
3.66%
Values in Rs Cr.
Direction Arrows
Net Sales

Growth in half year ended Sep 2025 is -20.31% vs 38.86% in Sep 2024

Direction Arrows
Consolidated Net Profit

Growth in half year ended Sep 2025 is 68.87% vs -1,614.29% in Sep 2024

Nine Monthly Results Snapshot (Consolidated) - Dec'25stock-summary

Dec'25
Dec'24
Change(%)
Net Sales
100.87
118.39
-14.80%
Operating Profit (PBDIT) excl Other Income
0.35
-3.49
110.03%
Interest
1.75
1.84
-4.89%
Exceptional Items
0.00
0.00
Consolidate Net Profit
-0.85
-3.77
77.45%
Operating Profit Margin (Excl OI)
0.35%
-2.95%
3.30%
Values in Rs Cr.
Direction Arrows
Net Sales

YoY Growth in nine months ended Dec 2025 is -14.80% vs 42.09% in Dec 2024

Direction Arrows
Consolidated Net Profit

YoY Growth in nine months ended Dec 2025 is 77.45% vs -1,242.42% in Dec 2024

Annual Results Snapshot (Consolidated) - Mar'26stock-summary

Mar'26
Mar'25
Change(%)
Net Sales
165.71
158.57
4.50%
Operating Profit (PBDIT) excl Other Income
3.03
-2.54
219.29%
Interest
2.41
2.17
11.06%
Exceptional Items
0.00
0.00
Consolidate Net Profit
0.54
-3.72
114.52%
Operating Profit Margin (Excl OI)
1.83%
-1.60%
3.43%
Values in Rs Cr.
Direction Arrows
Net Sales

YoY Growth in year ended Mar 2026 is 4.50% vs 52.40% in Mar 2025

Direction Arrows
Consolidated Net Profit

YoY Growth in year ended Mar 2026 is 114.52% vs -2,425.00% in Mar 2025

stock-summaryCompany CV
About Inducto Steel Ltd stock-summary
stock-summary
Inducto Steel Ltd
Micro Cap
Iron & Steel Products
Inducto Steel Limited (ISL) was incorporated in the State of Gujarat in November, 1988. The Company is now a diversified company in its ship breaking activities and trading in metal scrap, coals, aluminum foil & other inputs. During the year 1996-97, production was affected due to the fire in the plant of the company. In the same year company came out with a public issue of 23,36,000 equity shares of Rs. 10/- each for cash at par.
Company Coordinates stock-summary
Company Details
156 Maker Chambers VI 220, Jamnalal Bajaj Marg NarimanPoi Mumbai Maharashtra : 400021
stock-summary
Tel: 91-22-22043211
stock-summary
contact@hariyanagroup.com
Registrar Details
Sharex Dynamic (India) Pvt Ltd , Unit -1, Luthra Ind. Premises , Safed Pool, Andheri-Kurla Road, Andheri (E), Mumbai
Footer loading