
Compare Indl. Inv. Trust with Similar Stocks
Stock DNA
Non Banking Financial Company (NBFC)
INR 313 Cr (Micro Cap)
NA (Loss Making)
20
0.00%
0.00
-2.88%
0.71
Total Returns (Price + Dividend) 
Latest dividend: 1 per share ex-dividend date: Sep-07-2015
Risk Adjusted Returns v/s
Returns Beta

News
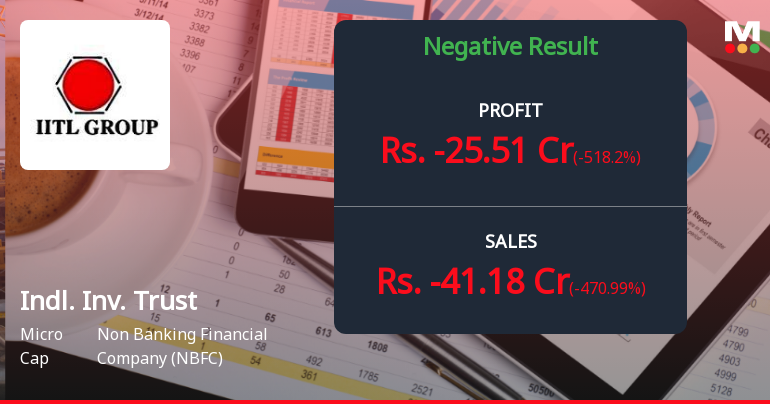
Industrial Investment Trust Q4 FY26: Heavy Losses Sink Micro-Cap NBFC as Turnaround Hopes Fade
Industrial Investment Trust Ltd. (IITL), a micro-cap non-banking financial company with a legacy dating back to 1933, reported a dismal fourth quarter for FY26, posting a consolidated net loss of ₹25.51 crores compared to a loss of ₹7.54 crores in the year-ago period. The sharp deterioration marks a dramatic reversal from the profitable quarters witnessed earlier in the fiscal year, sending the stock down 2.95% to ₹166.15 in trading following the results announcement.
Read full news article
Industrial Investment Trust Ltd is Rated Strong Sell
Industrial Investment Trust Ltd is rated Strong Sell by MarketsMOJO. This rating was last updated on 04 Feb 2025. However, the analysis and financial metrics discussed below reflect the stock’s current position as of 16 May 2026, providing investors with an up-to-date view of the company’s performance and outlook.
Read full news article Announcements
Closure of Trading Window
08-Jun-2026 | Source : BSEIntimation for withdrawal of closure of Trading Window. Further to our intimation dt.27.05.2026 regarding closure of Trading Window for dealing in securities of the Co. pursuant to provisions of SEBI (PIT) Regulations 2015 and the Cos Code of Conduct for Prevention of Insider Trading the Co. had intimated that the Trading window will be closed for all connected/ designated persons of the Co. w.e.f. start of trading hours of 28.05.2026 extending until the conclusion of 30.06.2026. We hereby inform you that the Co. has decided to discontinue with the ongoing assessments within the Co. concerning a potential corporate initiative. Accordingly the closure of Trading Window for dealing in securities of the Co.no longer exist. Hence the trading window for dealing i the securities of the Co. shall remain open for all designated persons and their immediate relative with immediate effect.
Closure of Trading Window
27-May-2026 | Source : BSEIntimation of closure of Trading Window
Intimation Of Submission Of Application For Reclassification Of Promoter From Promoter Category To Public Category Shareholders Of The Company Pursuant To Regulation 30 & 31A Of Securities And Exchange Board Of India (Listing Obligations And Disclosure
26-May-2026 | Source : BSEIntimation of submission of application for Reclassification from Promoter to Public category of the Company pursuant to Regulation 30 and 31A of SEBI (LODR) Regulations 2015
Corporate Actions

No Upcoming Board Meetings

Industrial Investment Trust Ltd has declared 10% dividend, ex-date: 07 Sep 15

No Splits history available

No Bonus history available

No Rights history available
Quality key factors
Valuation key factors
Technicals key factors
 Technical Indicator Scale: Bearish, Mildly Bearish, Sideways, Mildly Bullish, Bullish Turned
 Shareholding Snapshot : Mar 2026
Shareholding Compare (%holding)
Promoters
None
Held by 0 Schemes
Held by 2 FIIs (5.3%)
N N Financial Services P Ltd (36.15%)
Pratik M Sheth (10.11%)
19.33%
Quarterly Results Snapshot (Consolidated) - Mar'26 - QoQ

QoQ Growth in quarter ended Mar 2026 is -470.99% vs 1,453.66% in Dec 2025
QoQ Growth in quarter ended Mar 2026 is -518.20% vs 285.41% in Dec 2025
Half Yearly Results Snapshot (Consolidated) - Sep'25
Growth in half year ended Sep 2025 is -43.70% vs 130.83% in Sep 2024
Growth in half year ended Sep 2025 is -58.20% vs 274.44% in Sep 2024
Nine Monthly Results Snapshot (Consolidated) - Dec'25

YoY Growth in nine months ended Dec 2025 is 17.64% vs 17.08% in Dec 2024
YoY Growth in nine months ended Dec 2025 is 13.34% vs -70.86% in Dec 2024
Annual Results Snapshot (Consolidated) - Mar'26
YoY Growth in year ended Mar 2026 is -192.70% vs -54.54% in Mar 2025
YoY Growth in year ended Mar 2026 is -409.73% vs -93.82% in Mar 2025
About Industrial Investment Trust Ltd

Company Coordinates


