
Compare Indl.& Prud.Inv. with Similar Stocks
Dashboard
Weak Long Term Fundamental Strength with an average Return on Equity (ROE) of 6.90%
- Poor long term growth as Net Sales has grown by an annual rate of -4.21% and Operating profit at -5.80%
Flat results in Mar 26
Despite the size of the company, domestic mutual funds hold only 0% of the company
Stock DNA
Non Banking Financial Company (NBFC)
INR 1,068 Cr (Micro Cap)
17.00
21
1.73%
0.00
7.50%
1.25
Total Returns (Price + Dividend) 
Latest dividend: 110 per share ex-dividend date: Aug-19-2025
Risk Adjusted Returns v/s
Returns Beta

News

Industrial & Prudential Investment Company Ltd is Rated Sell
Industrial & Prudential Investment Company Ltd is rated 'Sell' by MarketsMOJO, with this rating last updated on 20 May 2026. However, the analysis and financial metrics discussed here reflect the stock's current position as of 20 June 2026, providing investors with the most up-to-date view of the company’s fundamentals, returns, and market standing.
Read full news article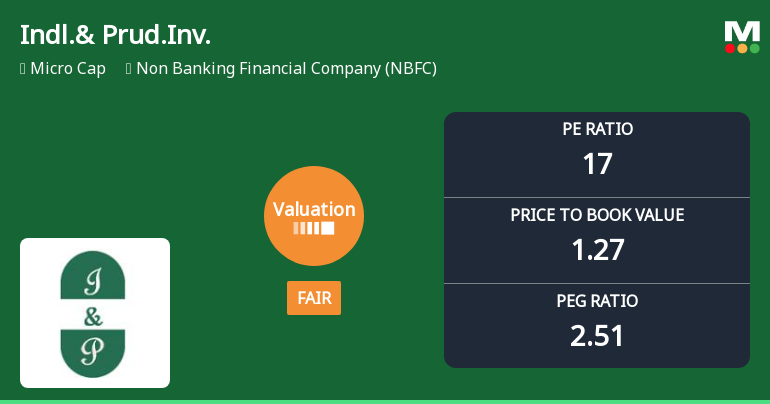
Industrial & Prudential Investment Company Ltd: Valuation Shifts Signal Fair Price Attractiveness
Industrial & Prudential Investment Company Ltd, a micro-cap player in the Non Banking Financial Company (NBFC) sector, has seen its valuation grade move from attractive to fair, reflecting a notable shift in price attractiveness. With a current price of ₹6,450 and a P/E ratio of 16.96, the company’s valuation metrics now align more closely with sector peers, prompting a reassessment of its investment appeal amid evolving market dynamics.
Read full news article
Industrial & Prudential Investment Company Ltd is Rated Sell
Industrial & Prudential Investment Company Ltd is rated 'Sell' by MarketsMOJO. This rating was last updated on 20 May 2026, reflecting a shift from a previous 'Strong Sell' stance. However, the analysis and financial metrics discussed below represent the stock's current position as of 09 June 2026, providing investors with an up-to-date view of the company’s fundamentals, returns, and market performance.
Read full news article Announcements
Compliances-Reg.24(A)-Annual Secretarial Compliance
25-May-2026 | Source : BSEPlease find enclosed the Annual Secretarial Compliance Report for the financial year ended 31 March 2026.
Announcement under Regulation 30 (LODR)-Newspaper Publication
23-May-2026 | Source : BSENewspaper advertisement pertaining to the financial results of the Company for the quarter and year ended March 31 2026.
Results For The Financial Year 2025-26
22-May-2026 | Source : BSEThe Board of Directors of the Company at their meeting held today has approved and taken on record the audited financial results on standalone and consolidated basis for the year ended March 31 2026 along with the Auditors report thereon. The Board of Directors have also recommended a dividend of Rs. 120 per share of face value of Rs. 10 each subject to approval of members at the Annual General Meeting.
Corporate Actions

No Upcoming Board Meetings

Industrial & Prudential Investment Company Ltd has declared 1100% dividend, ex-date: 19 Aug 25

No Splits history available

Industrial & Prudential Investment Company Ltd has announced 2:1 bonus issue, ex-date: 18 Jul 16

No Rights history available
Quality key factors
Valuation key factors
Technicals key factors
 Technical Indicator Scale: Bearish, Mildly Bearish, Sideways, Mildly Bullish, Bullish Turned
 Shareholding Snapshot : Mar 2026
Shareholding Compare (%holding)
Promoters
None
Held by 0 Schemes
Held by 1 FIIs (0.56%)
Paharpur Cooling Towers Limited (44.57%)
Vinod Dadlani (1.44%)
24.97%
Quarterly Results Snapshot (Consolidated) - Mar'26 - YoY

YoY Growth in quarter ended Mar 2026 is -19.64% vs -3.45% in Mar 2025
YoY Growth in quarter ended Mar 2026 is 7.17% vs 34.65% in Mar 2025
Half Yearly Results Snapshot (Consolidated) - Sep'25
Growth in half year ended Sep 2025 is -8.56% vs 34.20% in Sep 2024
Growth in half year ended Sep 2025 is 5.84% vs 13.39% in Sep 2024
Nine Monthly Results Snapshot (Consolidated) - Dec'25
YoY Growth in nine months ended Dec 2025 is -8.78% vs 22.85% in Dec 2024
YoY Growth in nine months ended Dec 2025 is 6.62% vs 16.18% in Dec 2024
Annual Results Snapshot (Consolidated) - Mar'26
YoY Growth in year ended Mar 2026 is -9.62% vs 20.33% in Mar 2025
YoY Growth in year ended Mar 2026 is 6.75% vs 20.70% in Mar 2025
About Industrial & Prudential Investment Company Ltd

Company Coordinates


