
Compare Infinity Infoway with Similar Stocks
Stock DNA
Software Products
INR 201 Cr (Micro Cap)
29.00
20
0.00%
-0.38
16.75%
4.79
Total Returns (Price + Dividend) 
Infinity Infoway for the last several years.
Risk Adjusted Returns v/s
Returns Beta

News
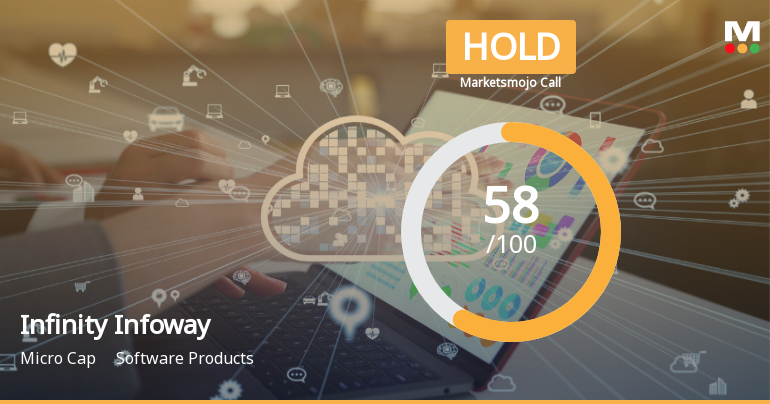
Infinity Infoway Ltd Upgraded to Hold as Technicals Improve and Valuation Stabilises
Infinity Infoway Ltd, a micro-cap player in the Software Products sector, has seen its investment rating upgraded from Sell to Hold as of 26 May 2026. This change reflects a combination of improved technical indicators, stable financial trends, and a reassessment of valuation metrics, signalling a cautious but more optimistic outlook for investors.
Read full news article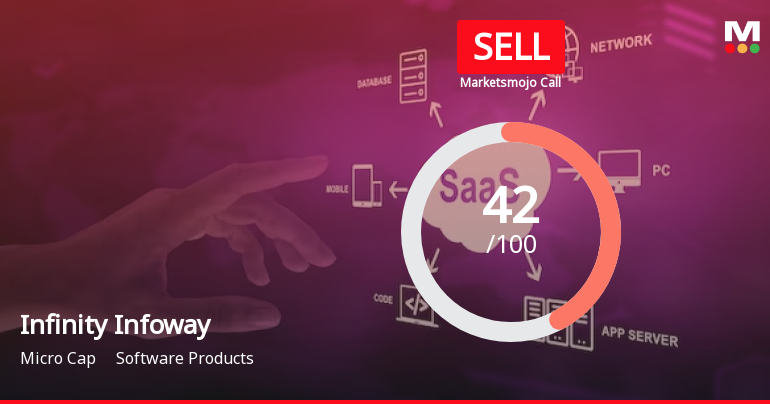
Infinity Infoway Ltd is Rated Sell
Infinity Infoway Ltd is rated 'Sell' by MarketsMOJO, with this rating last updated on 13 May 2026. However, the analysis and financial metrics discussed here reflect the stock's current position as of 25 May 2026, providing investors with an up-to-date view of the company’s fundamentals, valuation, financial trends, and technical outlook.
Read full news article
Infinity Infoway Ltd Downgraded to Sell Amid Technical and Valuation Concerns
Infinity Infoway Ltd, a micro-cap player in the Software Products sector, has seen its investment rating downgraded from Hold to Sell as of 13 May 2026. This change reflects a combination of deteriorating technical indicators, expensive valuation metrics, and a lack of financial momentum despite some positive long-term growth signals.
Read full news article Announcements
Announcement under Regulation 30 (LODR)-Press Release / Media Release
16-May-2026 | Source : BSEPress release of Zerotouch Daas technology
Disclosure Under Regulation 30 Of SEBI (LODR) Regulations 2015 - Voluntary Intimation Regarding Launch Of Zerotouch Machine Followed By Press Conference/Release
12-May-2026 | Source : BSEIntimation of launch of Zero -touch machine followed by press conference /release
Announcement under Regulation 30 (LODR)-Earnings Call Transcript
07-May-2026 | Source : BSEEarning call Transcript of 05.05.2026 for quarter ended and year ended on 31.03.2026
Corporate Actions

No Upcoming Board Meetings

No Dividend history available

No Splits history available

No Bonus history available

No Rights history available
Quality key factors
Valuation key factors
Technicals key factors
 Technical Indicator Scale: Bearish, Mildly Bearish, Sideways, Mildly Bullish, Bullish Turned
 Shareholding Snapshot : Mar 2026
Shareholding Compare (%holding)
Promoters
None
Held by 0 Schemes
Held by 1 FIIs (0.03%)
Gadhethriya Bhaveshkumar (48.63%)
Holani Venture Capital Fund- Holani Venture Capital Fund-i (5.25%)
12.87%
Quarterly Results Snapshot (Standalone) - Dec'25 - QoQ

QoQ Growth in quarter ended Dec 2025 is 20.16% vs 150.50% in Sep 2025
QoQ Growth in quarter ended Dec 2025 is 0.00% vs 685.00% in Sep 2025
Half Yearly Results Snapshot (Consolidated) - Mar'26

Growth in half year ended Mar 2026 is 91.66% vs 23.48% in Sep 2025
Growth in half year ended Mar 2026 is 50.36% vs 26.13% in Sep 2025
Nine Monthly Results Snapshot (Standalone) - Dec'25
Not Applicable: The company has declared_date for only one period
Not Applicable: The company has declared_date for only one period
Annual Results Snapshot (Consolidated) - Mar'26
YoY Growth in year ended Mar 2026 is 80.21% vs 29.70% in Mar 2025
YoY Growth in year ended Mar 2026 is 60.05% vs 26.22% in Mar 2025
About Infinity Infoway Ltd

Company Coordinates


