Info Edg.(India)

  • Market Cap: Large Cap
  • Industry: E-Retail/ E-Commerce
  • ISIN: INE663F01032
  • NSEID: NAUKRI
  • BSEID: 532777
INR
1,390.90
-3.2 (-0.23%)
BSENSE

Dec 05

BSE+NSE Vol: 12.61 k

  • Price Points
  • Score
  • Mojo Parameters
  • Total Return
  • News and Corporate Actions
  • Key factors
  • Shareholding
  • Financials
  • CompanyCV
stock-summaryPrice Point
High/Low

1Day

52 Week

Valuation
Technical
Day's Volume

CASH

12.61 k (551.13%) Volume

Shareholding (Sep 2025)

FII

30.33%

Held by 749 FIIs

DII

2.09%

Held by 62 DIIs

Promoter

37.59%

how big is Info Edg.(India)?

06-Jun-2025

As of Jun 06, Info Edge (India) Ltd has a market capitalization of 96,553.00 Cr and reported net sales of 2849.56 Cr and net profit of 962.14 Cr over the latest four quarters.

Market Cap: Info Edge (India) Ltd has a market capitalization of 96,553.00 Cr and is classified as a Large Cap company as of Jun 06.<BR><BR>Recent Quarterly Performance: The company reported a sum of Net Sales of 2849.56 Cr and a sum of Net Profit of 962.14 Cr for the latest 4 quarters, which is Consolidated data.<BR><BR>Balance Sheet Snapshot: This is Consolidated data for the latest annual period ending in Mar'24. The Shareholder's Funds are valued at 30,262.29 Cr, and the Total Assets amount to 36,089.40 Cr.

Read More

What does Info Edg.(India) do?

06-Jun-2025

Info Edge (India) Ltd is a prominent internet-based company in the E-Retail/E-Commerce sector, offering recruitment and real estate services through various platforms. As of March 2025, it reported net sales of ₹750 Cr and a net profit of ₹463 Cr, with a market capitalization of ₹97,182 Cr.

Overview: <BR>Info Edge (India) Ltd is a leading internet-based business operating in the E-Retail/E-Commerce industry, primarily providing recruitment and real estate services through various web portals and mobile applications.<BR><BR>History: <BR>Info Edge (India) Ltd was incorporated in the year N/A. The company has maintained its status as a premier internet-based service provider. The latest quarterly results reported net sales and net profit for the period ending March 2025.<BR><BR>Financial Snapshot: <BR>Most recent Net Sales: 750 Cr (Quarterly Results - Mar 2025) <BR>Most recent Net Profit: 463 Cr (Quarterly Results - Mar 2025) <BR>Market-cap value: Rs 97,182 Cr (Large Cap)<BR><BR>Key Metrics: <BR>P/E: 101.00 <BR>Industry P/E: 29 <BR>Dividend Yield: 0.33% <BR>Debt-Equity: -0.03 <BR>Return on Equity: 2.71% <BR>Price-to-Book: 2.74<BR><BR>Contact Details: <BR>Address: GF-12A 94 Meghdoot Building, Nehru Place New Delhi New Delhi : 110019 <BR>Phone: 91-11-26463894/0120-2082000 <BR>Email: investors@naukri.com <BR>Website: http://www.infoedge.in

Read More

What is the bonus history of the Info Edg.(India)?

06-Jun-2025

Info Edge (India) has issued bonuses twice, with a 1:1 bonus on June 22, 2012, and another 1:1 bonus on September 27, 2010, reflecting a consistent practice of rewarding shareholders.

Info Edge (India) has a history of issuing bonuses, with two notable instances. The most recent bonus was a 1:1 bonus issue announced on June 22, 2012, with a record date of June 26, 2012. Prior to that, the company also issued a 1:1 bonus on September 27, 2010, with a record date of September 28, 2010. This indicates a consistent approach to rewarding shareholders through bonus shares.

Read More

Who are the peers of the Info Edg.(India)?

03-Jun-2025

Peers of Info Edg. (India) include Eternal Ltd, Swiggy, FSN E-Commerce, Indiamart Inter., and Just Dial. Info Edg. has average management risk, average growth, and an excellent capital structure, with a 1-year return of 25.41%.

Peers: Eternal Ltd, Info Edg.(India), Swiggy, FSN E-Commerce, Brainbees Solut., Indiamart Inter., Just Dial, Cartrade Tech, RattanIndia Ent, Matrimony.com.<BR><BR>Quality Snapshot: Excellent management risk is observed at Indiamart Inter. and Matrimony.com, while Average management risk is found at Info Edg.(India), Eternal Ltd, Just Dial, Cartrade Tech, and RattanIndia Ent, and Below Average management risk is noted at Swiggy, FSN E-Commerce, Brainbees Solut. and the rest. For Growth, Excellent growth is seen at FSN E-Commerce, Brainbees Solut., and RattanIndia Ent, while Good growth is noted at Eternal Ltd, Swiggy, Cartrade Tech, and Indiamart Inter., and Average growth is present at Info Edg.(India) and the rest. In terms of Capital Structure, Excellent capital structure is found at Info Edg.(India), Indiamart Inter., Just Dial, and Matrimony.com, while Below Average is noted at Eternal Ltd, Swiggy, FSN E-Commerce, Brainbees Solut., and the rest.<BR><BR>Return Snapshot: The peer with the highest 1-year return is Eternal Ltd at 37.58%, while the peer with the lowest is RattanIndia Ent at -35.53%. Info Edg.(India) has a 1-year return of 25.41%, which is significantly higher than RattanIndia Ent but lower than Eternal Ltd. Additionally, the peers with negative six-month returns include Eternal Ltd, Swiggy, Brainbees Solut., RattanIndia Ent, Matrimony.com, and Macfos.

Read More

Who are in the management team of Info Edg.(India)?

16-Jul-2025

As of March 2022, the management team of Info Edg. (India) includes Kapil Kapoor (Chairman), Sanjeev Bikhchandani (Executive Vice Chairman), Hitesh Oberoi (MD & CEO), and several independent and whole-time directors, totaling 14 members. This diverse team oversees the company's governance and strategic direction.

As of March 2022, the management team of Info Edg.(India) includes the following individuals:<BR><BR>1. Kapil Kapoor - Chairman (Non-Executive)<BR>2. Sanjeev Bikhchandani - Executive Vice Chairman & Whole Time Director<BR>3. Hitesh Oberoi - Managing Director & CEO<BR>4. Saurabh Srivastava - Independent Director<BR>5. Naresh Gupta - Independent Director<BR>6. Sharad Malik - Independent Director<BR>7. Chintan Thakkar - Whole Time Director & CFO<BR>8. Ashish Gupta - Independent Director<BR>9. Geeta Mathur - Independent Director<BR>10. Bala Deshpande - Director<BR>11. Sanjiv Sachar - Independent Director<BR>12. Pawan Goyal - Whole-time Director<BR>13. Arindam Bhattacharya - Independent Director<BR>14. Aruna Sundararajan - Independent Director<BR><BR>This diverse team comprises executive, non-executive, and independent directors, contributing to the company's governance and strategic direction.

Read More

Who are the top shareholders of the Info Edg.(India)?

17-Jul-2025

The top shareholder of Info Edg. (India) is Sanjeev Bikhchandani, with 24.18% ownership. Promoters hold the majority of shares, while institutional investors, including FIIs and mutual funds, own 43.86%, and individual shareholders hold 7.13%.

The top shareholders of Info Edg. (India) include a mix of promoters, institutional investors, and individual shareholders. The largest shareholder is Sanjeev Bikhchandani, who holds 24.18% of the company. Promoters collectively hold the majority of shares, and there are no pledged promoter holdings. <BR><BR>In terms of institutional investments, 34 mutual fund schemes hold a combined 10.61%, while foreign institutional investors (FIIs) own 33.25% of the shares. The highest public shareholder is the Life Insurance Corporation of India, which holds 4%. Individual investors collectively hold 7.13% of the shares.

Read More

When is the next results date for Info Edg.(India)?

24-Jul-2025

Info Edg. (India) is scheduled to declare its results on 08 August 2025.

Info Edg.(India) is scheduled to declare its results on 08 August 2025.

Read More

Are Info Edg.(India) latest results good or bad?

08-Aug-2025

Info Edge (India) reported mixed results for Q2 2025, with net sales at Rs 790.86 crore (up 5.50%) and a 22.8% increase in Profit Before Tax (PBT) to Rs 222.48 crore. However, net profit fell 36.14%, raising concerns about sustainability, and nearly 49% of PBT came from non-operating income, indicating potential risks to long-term performance.

Info Edge (India) has reported a mixed financial performance for the quarter ending June 2025. On the positive side, the company achieved net sales of Rs 790.86 crore, which is the highest quarterly sales in the last five quarters, and reflects a growth of 5.50% compared to the previous quarter. Profit Before Tax (PBT) also showed a healthy increase of 22.8%, reaching Rs 222.48 crore.<BR><BR>However, there are some concerning aspects as well. The net profit decreased significantly by 36.14% compared to the previous quarter, which raises questions about the sustainability of the company's profitability. Additionally, a substantial portion of the PBT, nearly 49%, came from non-operating income, indicating a reliance on non-business activities. This could pose risks to the long-term business model. Furthermore, the cash and cash equivalents have declined to Rs 267.13 crore, suggesting a deterioration in short-term liquidity.<BR><BR>Overall, while there are some positive indicators in terms of sales growth and PBT, the drop in net profit and reliance on non-operating income highlight challenges that could impact the company's future performance.

Read More

How has been the historical performance of Info Edg.(India)?

13-Nov-2025

Info Edg. (India) has shown significant growth, with net sales increasing from 1,120.12 crore in March 2021 to 2,849.55 crore in March 2025, and net profit reaching 962.14 crore in the same period. The company's total assets grew substantially, reflecting a strong upward trend in financial performance.

Answer:<BR>The historical performance of Info Edg.(India) shows significant growth in net sales and profit over the years, culminating in a net profit of 962.14 crore for the year ending March 2025.<BR><BR>Breakdown:<BR>Info Edg.(India) has demonstrated a consistent upward trend in net sales, increasing from 1,120.12 crore in March 2021 to 2,849.55 crore in March 2025. The total operating income followed a similar trajectory, reaching 2,849.55 crore in March 2025, up from 1,120.12 crore in March 2021. Operating profit (PBDIT) also rose significantly, from 273.40 crore in March 2021 to 2,057.96 crore in March 2025, indicating improved operational efficiency. Profit before tax surged to 2,067.61 crore in March 2025, reflecting a strong performance despite fluctuations in previous years. The profit after tax reached 1,432.89 crore in March 2025, a notable increase from 483.27 crore in March 2020. The company's total assets grew from 2,865.30 crore in March 2020 to 42,770.69 crore in March 2025, while total liabilities also increased, reflecting the company's expansion. Cash flow from operating activities improved to 875.00 crore in March 2025, contributing to a net cash outflow of 68.00 crore for the same period. Overall, the financial metrics indicate a robust growth trajectory for Info Edg.(India) over the years.

Read More

Has Info Edg.(India) declared dividend?

14-Nov-2025

Yes, Info Edge (India) Ltd has declared a dividend of 120% (₹3.6 per share) with an ex-date of November 21, 2025. Despite recent volatility in returns, the company has shown strong growth over the longer term, particularly in the 2 to 5-year periods.

Info Edge (India) Ltd has declared a dividend.<BR><BR>Dividend Details:<BR>- Percentage announced: 120%<BR>- Amount per share: 3.6<BR>- Ex-date: 21 Nov 25<BR><BR>Dividend Yield: 0.44%<BR><BR>Total Returns by Period:<BR>In the last 3 months, the price return was -3.09%, the dividend return was 0.18%, resulting in a total return of -2.91%.<BR><BR>Over the past 6 months, the price return was -9.35%, the dividend return was 0.41%, leading to a total return of -8.94%.<BR><BR>In the 1-year period, the price return was -15.1%, the dividend return was 0.39%, culminating in a total return of -14.71%.<BR><BR>For the 2-year period, the price return was 46.76%, the dividend return was 3.30%, resulting in a total return of 50.06%.<BR><BR>In the last 3 years, the price return was 51.68%, the dividend return was 6.14%, leading to a total return of 57.82%.<BR><BR>Over the past 4 years, the price return was 3.3%, the dividend return was 6.38%, resulting in a total return of 9.68%.<BR><BR>In the 5-year period, the price return was 70.43%, the dividend return was 8.71%, culminating in a total return of 79.14%.<BR><BR>Overall, Info Edge (India) Ltd has declared a significant dividend, and while recent returns have shown some volatility, the longer-term performance indicates strong growth, particularly in the 2 to 5-year periods.

Read More

Should I buy, sell or hold Info Edg.(India)?

15-Nov-2025

Is Info Edg.(India) technically bullish or bearish?

02-Dec-2025

As of December 1, 2025, the trend is mildly bearish, with daily moving averages and monthly MACD indicating bearish signals, despite some bullish signs on the weekly charts.

As of 1 December 2025, the technical trend has changed from bearish to mildly bearish. The current stance is mildly bearish, driven by the daily moving averages indicating a bearish trend and the monthly MACD showing a mildly bearish signal. The weekly Bollinger Bands are bullish, but this is offset by the overall bearish indicators in the monthly timeframe, including the KST and the Dow Theory. The RSI shows no signals in both weekly and monthly timeframes, indicating a lack of momentum. Overall, while there are some mildly bullish signals on the weekly charts, the prevailing trend remains bearish.

Read More

Why is Info Edg.(India) falling/rising?

04-Dec-2025

As of 04-Dec, Info Edge (India) Ltd's stock price is rising to 1,393.90, up 1.32%, driven by strong fundamentals and recent positive performance despite a year-to-date decline of 19.90%. The stock's growth is supported by healthy sales and profit increases, although declining investor participation may indicate caution.

As of 04-Dec, Info Edge (India) Ltd's stock price is rising, currently at 1,393.90, reflecting an increase of 18.2 or 1.32%. This upward movement can be attributed to several positive factors. The stock has shown a performance of +4.02% over the past week, significantly outperforming the Sensex, which declined by 0.53% during the same period. Additionally, the company has demonstrated healthy long-term growth, with net sales increasing at an annual rate of 20.48% and operating profit at 26.15%. Furthermore, the company has reported positive results for the last four consecutive quarters, including a record net sales figure of Rs 805.45 crore.<BR><BR>Despite a year-to-date decline of 19.90%, the stock's recent performance and strong fundamentals, such as a low debt-to-equity ratio and high institutional holdings at 52%, suggest that investors may have confidence in its potential for recovery. However, it is important to note that there has been a decline in investor participation, with delivery volume falling by 43.52% against the five-day average. This could indicate a cautious sentiment among some investors. Overall, the combination of recent positive performance and strong fundamentals appears to be driving the stock's rise.

Read More
iScoreScore
Click here to find our call on this stock
Strong Sell
Sell
Hold
Buy
Strong Buy

MarketsMojo — Loved in India, Now Global

The power of Mojo is now in 29 countries. Explore global equities with the same cutting-edge features you love.

Dashboard
1

With ROE of 2.7, it has a Very Expensive valuation with a 1.9 Price to Book Value

  • The stock is trading at a discount compared to its peers' average historical valuations
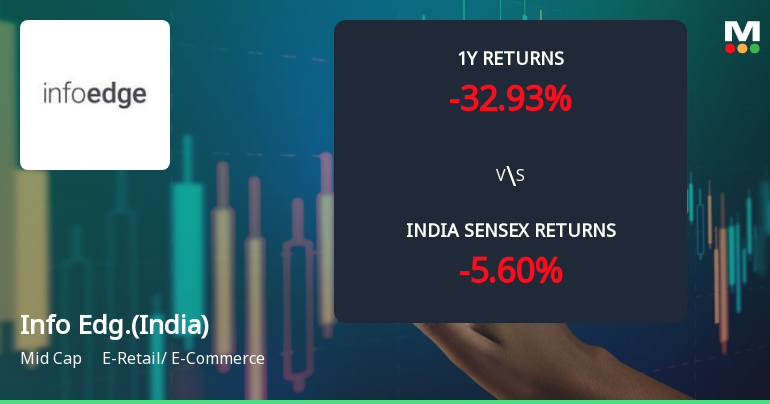
  • Over the past year, while the stock has generated a return of -17.65%, its profits have risen by 151.6% ; the PEG ratio of the company is 0.5
2

Underperformed the market in the last 1 year

stock-summaryMojo Parameters
Mojo Parameters
Loading Valuation Snapshot...
Stock DNA
stock-summary
Industry

E-Retail/ E-Commerce

stock-summary
Market cap

INR 90,189 Cr (Large Cap)

stock-summary
P/E

69.00

stock-summary
Industry P/E

28

stock-summary
Dividend Yield

0.43%

stock-summary
Debt Equity

-0.03

stock-summary
Return on Equity

2.70%

stock-summary
Price to Book

1.86

Revenue and Profits:
Net Sales:
805 Cr
(Quarterly Results - Sep 2025)
Net Profit:
316 Cr
stock-summaryTotal Returns
Total Returns (Price + Dividend) stock-summary
Dividend Yield (0.43%)
TimePeriod
Price Return
Dividend Return
Total Return
3 Months
3.33%
0.18%
3.51%
6 Months
-5.65%
0.39%
-5.26%
1 Year
-18.38%
0.35%
-18.03%
2 Years
48.53%
2.89%
51.42%
3 Years
71.48%
5.92%
77.4%
4 Years
19.48%
6.65%
26.13%
5 Years
64.22%
8.39%
72.61%

Latest dividend: 2.4 per share ex-dividend date: Nov-21-2025

Risk Adjusted Returns v/s stock-summary
Returns Beta
Icon
Beta has not been calculated since enough price history is not available
stock-summaryNews & Corporate Actions
Announcements stock-summary

Company Update On Naukri Jobspeak Report

01-Dec-2025 | Source : BSE

Company Update on Naukri Jobspeak Report

Announcement under Regulation 30 (LODR)-Analyst / Investor Meet - Intimation

27-Nov-2025 | Source : BSE

Schedule of the proposed Analyst/Institutional Investors meet under the Securities and Exchange Board of India (Listing Obligations and Disclosure Requirements) Regulations 2015 to be held on December 3 2025 with M&G Investment Management.

Announcement under Regulation 30 (LODR)-Analyst / Investor Meet - Intimation

27-Nov-2025 | Source : BSE

Schedule of the proposed Analyst/Institutional Investors meet under the Securities and Exchange Board of India (Listing Obligations and Disclosure Requirements) Regulations 2015 to be held on December 3 2025 with First State Invs Ltd.

Corporate Actions stock-summary
stock-summary
BOARD MEETING

No Upcoming Board Meetings

stock-summary
DIVIDEND

Info Edge (India) Ltd has declared 120% dividend, ex-date: 21 Nov 25

stock-summary
SPLITS

Info Edge (India) Ltd has announced 2:10 stock split, ex-date: 07 May 25

stock-summary
BONUS

Info Edge (India) Ltd has announced 1:1 bonus issue, ex-date: 22 Jun 12

stock-summary
RIGHTS

No Rights history available

stock-summaryKey Factors
Quality key factors stock-summary
Factor
Value
Sales Growth (5y)
20.48%
EBIT Growth (5y)
26.15%
EBIT to Interest (avg)
45.02
Debt to EBITDA (avg)
0.25
Net Debt to Equity (avg)
-0.03
Sales to Capital Employed (avg)
0.11
Tax Ratio
16.01%
Dividend Payout Ratio
49.39%
Pledged Shares
0
Institutional Holding
52.00%
ROCE (avg)
2.80%
ROE (avg)
5.39%
Valuation key factors
Factor
Value
P/E Ratio
69
Industry P/E
28
Price to Book Value
1.86
EV to EBIT
94.57
EV to EBITDA
83.69
EV to Capital Employed
1.88
EV to Sales
29.02
PEG Ratio
0.45
Dividend Yield
0.43%
ROCE (Latest)
1.99%
ROE (Latest)
2.70%
Technicals key factors
Indicator
Weekly
Monthly
MACD
Mildly Bullish
Mildly Bearish
RSI
No Signal
No Signal
Bollinger Bands
Bullish
Mildly Bearish
Moving Averages
Mildly Bearish (Daily)
KST
Mildly Bullish
Mildly Bearish
Dow Theory
Mildly Bullish
Mildly Bearish
OBV
Mildly Bullish
Mildly Bearish
stock-summary Technical Indicator Scale: Bearish, Mildly Bearish, Sideways, Mildly Bullish, Bullish  Turned 
stock-summaryShareholding
Shareholding Snapshot : Sep 2025stock-summary
Shareholding Compare (%holding) stock-summary
Majority shareholders

Promoters

Pledged Promoter Holdings

None

Mutual Funds

Held by 37 Schemes (13.85%)

FIIs

Held by 749 FIIs (30.33%)

Promoter with highest holding

Sanjeev Bikhchandani (24.15%)

Highest Public shareholder

Icici Prudential Focus Equity Fund (3.98%)

Individual Investors Holdings

7.23%

stock-summaryFinancial
[
  {
    "link": "quarterly",
    "btn_text": "All Quarterly Results",
    "header": "Quarterly Results Snapshot (Consolidated) - Sep'25 - QoQ",
    "rhs": [
      {
        "prefix": "Net Sales ",
        "suffix": "QoQ Growth in quarter ended Sep 2025 is 1.84% vs 5.50% in Jun 2025",
        "dir": -1
      },
      {
        "prefix": "Consolidated Net Profit ",
        "suffix": "QoQ Growth in quarter ended Sep 2025 is 6.92% vs -36.14% in Jun 2025",
        "dir": 1
      }
    ],
    "table": {
      "header": [
        "Sep'25",
        "Jun'25",
        "Change(%)"
      ],
      "body": [
        {
          "field": "Net Sales",
          "val1": "805.45",
          "val2": "790.86",
          "chgp": "1.84%",
          "chgp_class": "positive"
        },
        {
          "field": "Operating Profit (PBDIT) excl Other Income",
          "val1": "279.87",
          "val2": "264.48",
          "chgp": "5.82%",
          "chgp_class": "positive"
        },
        {
          "field": "Interest",
          "val1": "6.98",
          "val2": "6.59",
          "chgp": "5.92%",
          "chgp_class": "negative"
        },
        {
          "field": "Exceptional Items",
          "val1": "25.11",
          "val2": "-4.63",
          "chgp": "642.33%",
          "chgp_class": "positive"
        },
        {
          "field": "Consolidate Net Profit",
          "val1": "316.40",
          "val2": "295.92",
          "chgp": "6.92%",
          "chgp_class": "positive"
        },
        {
          "field": "Operating Profit Margin (Excl OI)",
          "val1": "34.75%",
          "val2": "33.44%",
          "chgp": "1.31%",
          "chgp_class": "positive"
        }
      ]
    }
  },
  {
    "link": "half-yearly",
    "btn_text": "All Half Yearly Results",
    "header": "Half Yearly Results Snapshot (Consolidated) - Sep'25",
    "rhs": [
      {
        "prefix": "Net Sales ",
        "suffix": " Growth in half year ended Sep 2025 is 15.88% vs 10.04% in Sep 2024",
        "dir": 1
      },
      {
        "prefix": "Consolidated Net Profit ",
        "suffix": " Growth in half year ended Sep 2025 is 139.03% vs -29.57% in Sep 2024",
        "dir": 1
      }
    ],
    "table": {
      "header": [
        "Sep'25",
        "Sep'24",
        "Change(%)"
      ],
      "body": [
        {
          "field": "Net Sales",
          "val1": "1,596.31",
          "val2": "1,377.53",
          "chgp": "15.88%",
          "chgp_class": "positive"
        },
        {
          "field": "Operating Profit (PBDIT) excl Other Income",
          "val1": "544.36",
          "val2": "465.03",
          "chgp": "17.06%",
          "chgp_class": "positive"
        },
        {
          "field": "Interest",
          "val1": "13.57",
          "val2": "11.62",
          "chgp": "16.78%",
          "chgp_class": "negative"
        },
        {
          "field": "Exceptional Items",
          "val1": "20.48",
          "val2": "167.23",
          "chgp": "-87.75%",
          "chgp_class": "negative"
        },
        {
          "field": "Consolidate Net Profit",
          "val1": "612.31",
          "val2": "256.16",
          "chgp": "139.03%",
          "chgp_class": "positive"
        },
        {
          "field": "Operating Profit Margin (Excl OI)",
          "val1": "34.10%",
          "val2": "33.76%",
          "chgp": "0.34%",
          "chgp_class": "positive"
        }
      ]
    }
  },
  {
    "link": "nine-monthly",
    "btn_text": "All Nine Monthly Results",
    "header": "Nine Monthly Results Snapshot (Consolidated) - Dec'24",
    "rhs": [
      {
        "prefix": "Net Sales ",
        "suffix": "YoY Growth in nine months ended Dec 2024 is 11.76% vs 7.93% in Dec 2023",
        "dir": 1
      },
      {
        "prefix": "Consolidated Net Profit ",
        "suffix": "YoY Growth in nine months ended Dec 2024 is -3.12% vs 211.24% in Dec 2023",
        "dir": -1
      }
    ],
    "table": {
      "header": [
        "Dec'24",
        "Dec'23",
        "Change(%)"
      ],
      "body": [
        {
          "field": "Net Sales",
          "val1": "2,099.93",
          "val2": "1,878.92",
          "chgp": "11.76%",
          "chgp_class": "positive"
        },
        {
          "field": "Operating Profit (PBDIT) excl Other Income",
          "val1": "736.68",
          "val2": "609.87",
          "chgp": "20.79%",
          "chgp_class": "positive"
        },
        {
          "field": "Interest",
          "val1": "17.76",
          "val2": "16.59",
          "chgp": "7.05%",
          "chgp_class": "negative"
        },
        {
          "field": "Exceptional Items",
          "val1": "121.46",
          "val2": "51.40",
          "chgp": "136.30%",
          "chgp_class": "positive"
        },
        {
          "field": "Consolidate Net Profit",
          "val1": "498.75",
          "val2": "514.82",
          "chgp": "-3.12%",
          "chgp_class": "negative"
        },
        {
          "field": "Operating Profit Margin (Excl OI)",
          "val1": "35.08%",
          "val2": "32.46%",
          "chgp": "2.62%",
          "chgp_class": "positive"
        }
      ]
    }
  },
  {
    "link": "annual",
    "btn_text": "All Annual Results",
    "header": "Annual Results Snapshot (Consolidated) - Mar'25",
    "rhs": [
      {
        "prefix": "Net Sales ",
        "suffix": "YoY Growth in year ended Mar 2025 is 12.35% vs 8.13% in Mar 2024",
        "dir": 1
      },
      {
        "prefix": "Consolidated Net Profit ",
        "suffix": "YoY Growth in year ended Mar 2025 is 67.27% vs 635.53% in Mar 2024",
        "dir": -1
      }
    ],
    "table": {
      "header": [
        "Mar'25",
        "Mar'24",
        "Change(%)"
      ],
      "body": [
        {
          "field": "Net Sales",
          "val1": "2,849.55",
          "val2": "2,536.34",
          "chgp": "12.35%",
          "chgp_class": "positive"
        },
        {
          "field": "Operating Profit (PBDIT) excl Other Income",
          "val1": "984.71",
          "val2": "829.25",
          "chgp": "18.75%",
          "chgp_class": "positive"
        },
        {
          "field": "Interest",
          "val1": "24.24",
          "val2": "22.26",
          "chgp": "8.89%",
          "chgp_class": "negative"
        },
        {
          "field": "Exceptional Items",
          "val1": "146.98",
          "val2": "-110.58",
          "chgp": "232.92%",
          "chgp_class": "positive"
        },
        {
          "field": "Consolidate Net Profit",
          "val1": "962.14",
          "val2": "575.21",
          "chgp": "67.27%",
          "chgp_class": "positive"
        },
        {
          "field": "Operating Profit Margin (Excl OI)",
          "val1": "34.56%",
          "val2": "32.69%",
          "chgp": "1.87%",
          "chgp_class": "positive"
        }
      ]
    }
  }
]
Quarterly Results Snapshot (Consolidated) - Sep'25 - QoQstock-summary
Sep'25
Jun'25
Change(%)
Net Sales
805.45
790.86
1.84%
Operating Profit (PBDIT) excl Other Income
279.87
264.48
5.82%
Interest
6.98
6.59
5.92%
Exceptional Items
25.11
-4.63
642.33%
Consolidate Net Profit
316.40
295.92
6.92%
Operating Profit Margin (Excl OI)
34.75%
33.44%
1.31%
Values in Rs Cr.
Direction Arrows
Net Sales

QoQ Growth in quarter ended Sep 2025 is 1.84% vs 5.50% in Jun 2025

Direction Arrows
Consolidated Net Profit

QoQ Growth in quarter ended Sep 2025 is 6.92% vs -36.14% in Jun 2025

Half Yearly Results Snapshot (Consolidated) - Sep'25stock-summary
Sep'25
Sep'24
Change(%)
Net Sales
1,596.31
1,377.53
15.88%
Operating Profit (PBDIT) excl Other Income
544.36
465.03
17.06%
Interest
13.57
11.62
16.78%
Exceptional Items
20.48
167.23
-87.75%
Consolidate Net Profit
612.31
256.16
139.03%
Operating Profit Margin (Excl OI)
34.10%
33.76%
0.34%
Values in Rs Cr.
Direction Arrows
Net Sales

Growth in half year ended Sep 2025 is 15.88% vs 10.04% in Sep 2024

Direction Arrows
Consolidated Net Profit

Growth in half year ended Sep 2025 is 139.03% vs -29.57% in Sep 2024

Nine Monthly Results Snapshot (Consolidated) - Dec'24stock-summary
Dec'24
Dec'23
Change(%)
Net Sales
2,099.93
1,878.92
11.76%
Operating Profit (PBDIT) excl Other Income
736.68
609.87
20.79%
Interest
17.76
16.59
7.05%
Exceptional Items
121.46
51.40
136.30%
Consolidate Net Profit
498.75
514.82
-3.12%
Operating Profit Margin (Excl OI)
35.08%
32.46%
2.62%
Values in Rs Cr.
Direction Arrows
Net Sales

YoY Growth in nine months ended Dec 2024 is 11.76% vs 7.93% in Dec 2023

Direction Arrows
Consolidated Net Profit

YoY Growth in nine months ended Dec 2024 is -3.12% vs 211.24% in Dec 2023

Annual Results Snapshot (Consolidated) - Mar'25stock-summary
Mar'25
Mar'24
Change(%)
Net Sales
2,849.55
2,536.34
12.35%
Operating Profit (PBDIT) excl Other Income
984.71
829.25
18.75%
Interest
24.24
22.26
8.89%
Exceptional Items
146.98
-110.58
232.92%
Consolidate Net Profit
962.14
575.21
67.27%
Operating Profit Margin (Excl OI)
34.56%
32.69%
1.87%
Values in Rs Cr.
Direction Arrows
Net Sales

YoY Growth in year ended Mar 2025 is 12.35% vs 8.13% in Mar 2024

Direction Arrows
Consolidated Net Profit

YoY Growth in year ended Mar 2025 is 67.27% vs 635.53% in Mar 2024

stock-summaryCompany CV
About Info Edge (India) Ltd stock-summary
stock-summary
Info Edge (India) Ltd
Large Cap
E-Retail/ E-Commerce
Info Edge (India) Limited is one of India's premier internet based business. The Company is primarily in the business of operating multiple internet based services through its various web portals and mobile applications. It currently operates in four service verticals such as, in recruitment solutions through its brands naukri.com, iimjobs.com, hirist.com, ambitionbox.com, bigshyft.com, jobhai.com; in real estate services through its brand 99acres.
Company Coordinates stock-summary
Company Details
GF-12A 94 Meghdoot Building, Nehru Place New Delhi New Delhi : 110019
stock-summary
Tel: 91-11-26463894/0120-2082000
stock-summary
investors@naukri.com
Registrar Details
Link Intime India Pvt Ltd., Narang Tower 44, Community Centre, Naraina Industrial Area , Phase - 1, New Delhi