
Compare INFRONEER Holdings, Inc. with Similar Stocks
Dashboard
Positive results in Jun 25
- PRE-TAX PROFIT(Q) At JPY 11,827 MM has Grown at 224.47%
- NET PROFIT(Q) At JPY 8,095 MM has Grown at 190.04%
- RAW MATERIAL COST(Y) Fallen by -18.93% (YoY)
With ROCE of 5.87%, it has a very attractive valuation with a 0.76 Enterprise value to Capital Employed
Market Beating performance in long term as well as near term
Total Returns (Price + Dividend) 
INFRONEER Holdings, Inc. for the last several years.
Risk Adjusted Returns v/s
News

INFRONEER Holdings Reports Significant Profit Growth Amid Cost Reductions and Market Positioning
INFRONEER Holdings, Inc. has recently experienced an evaluation adjustment reflecting its improved market position. The company reported significant growth in pre-tax and net profits for the quarter ending June 2025, alongside a reduction in raw material costs, enhancing its overall financial performance and valuation metrics.
Read full news article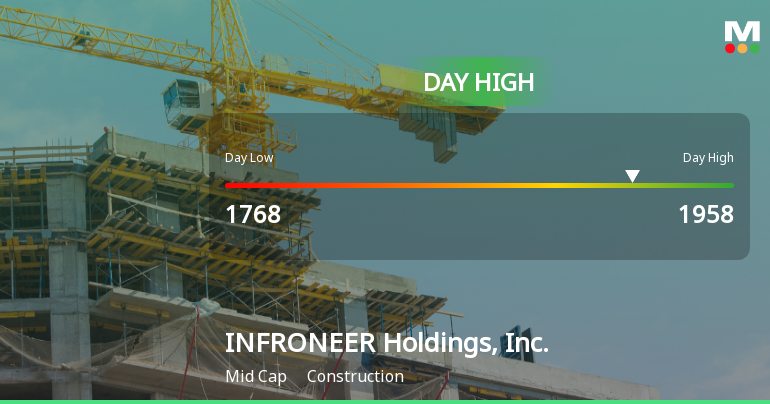
INFRONEER Holdings Hits Day High with Strong 6.28% Intraday Surge
INFRONEER Holdings, Inc. has experienced notable stock performance, with significant gains over various time frames, including a 61.3% annual increase. Despite a recent profit decline, the company maintains a strong market position, supported by favorable financial metrics such as a 5.87% return on capital employed.
Read full news article Announcements

Corporate Actions
Quality key factors
Valuation key factors
Technicals key factors
 Technical Indicator Scale: Bearish, Mildly Bearish, Sideways, Mildly Bullish, Bullish Turned
 Shareholding Snapshot
Shareholding Compare (%holding)
Quarterly Results Snapshot (Consolidated) - Jun'25 - YoY

YoY Growth in quarter ended Jun 2025 is 7.45% vs 11.19% in Jun 2024

YoY Growth in quarter ended Jun 2025 is 193.55% vs -32.98% in Jun 2024
Annual Results Snapshot (Consolidated) - Mar'25
YoY Growth in year ended Mar 2025 is 6.84% vs 11.44% in Mar 2024
YoY Growth in year ended Mar 2025 is -0.46% vs -3.80% in Mar 2024
About INFRONEER Holdings, Inc.

Company Coordinates


