
Compare Innovative Tech with Similar Stocks
Dashboard
Weak Long Term Fundamental Strength with a -2.49% CAGR growth in Net Sales over the last 5 years
- Company's ability to service its debt is weak with a poor EBIT to Interest (avg) ratio of 0.73
- The company has been able to generate a Return on Equity (avg) of 2.00% signifying low profitability per unit of shareholders funds
Below par performance in long term as well as near term
Total Returns (Price + Dividend) 
Latest dividend: 0.15 per share ex-dividend date: Sep-20-2019
Risk Adjusted Returns v/s
Returns Beta

News
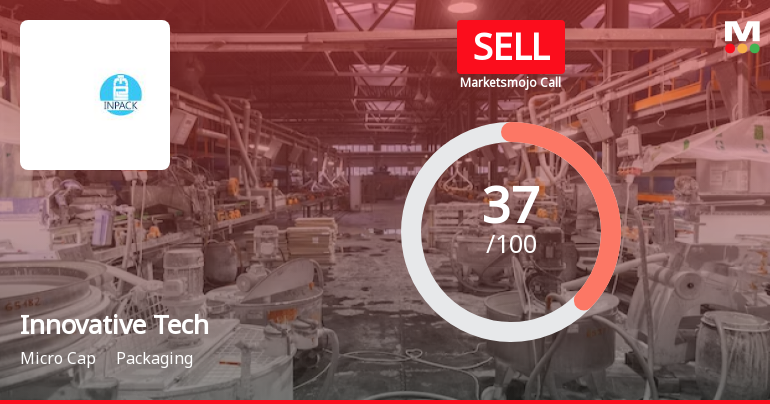
Innovative Tech Pack Ltd is Rated Sell
Innovative Tech Pack Ltd is rated 'Sell' by MarketsMOJO, with this rating last updated on 14 May 2026. However, the analysis and financial metrics discussed here reflect the company’s current position as of 19 June 2026, providing investors with an up-to-date view of the stock’s fundamentals, valuation, financial trend, and technical outlook.
Read full news article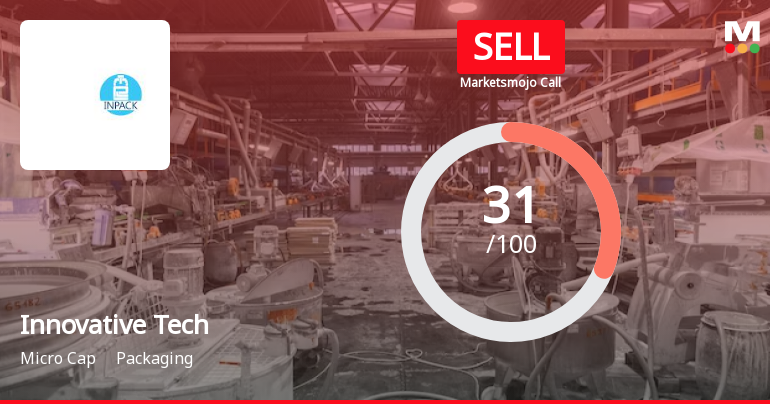
Innovative Tech Pack Ltd is Rated Sell
Innovative Tech Pack Ltd is rated Sell by MarketsMOJO, with this rating last updated on 14 May 2026. However, the analysis and financial metrics discussed here reflect the company’s current position as of 28 May 2026, providing investors with the latest insights into its performance and outlook.
Read full news article Announcements
Closure of Trading Window
24-Jun-2026 | Source : BSEIntimation of closure of trading window for the quarter ended 30th June 2026
Announcement under Regulation 30 (LODR)-Newspaper Publication
30-May-2026 | Source : BSEIntimation of Newspaper publication of financial results for the quarter and year ended 31st march 2026
Board Meeting Outcome for Outcome Of The Board Meeting Held On Friday 29Th May 2026 .
29-May-2026 | Source : BSEIn terms of the provisions of Regulation 33 SEBI (Listing Obligations and Disclosure Requirements) Regulations 2015 the Board of Directors of the Company at their meeting held today have inter alia approved and taken on record the following: 1. Audited Financial Results of the Company for the Quarter and year ended March 31 2026 along with Audit Report of the Statutory Auditor Statement of Assets and Liabilities and Statement of Cash Flow for the period. 2. And other agenda items.
Corporate Actions

No Upcoming Board Meetings

Innovative Tech Pack Ltd has declared 15% dividend, ex-date: 20 Sep 19

Innovative Tech Pack Ltd has announced 1:10 stock split, ex-date: 28 Oct 11

No Bonus history available

No Rights history available
Quality key factors
Valuation key factors
Technicals key factors
 Technical Indicator Scale: Bearish, Mildly Bearish, Sideways, Mildly Bullish, Bullish Turned
 Shareholding Snapshot : Mar 2026
Shareholding Compare (%holding)
Promoters
None
Held by 2 Schemes (0.06%)
Held by 0 FIIs
K Satish Rao (71.26%)
Renu (1.2%)
23.79%
Quarterly Results Snapshot (Standalone) - Mar'26 - YoY

YoY Growth in quarter ended Mar 2026 is -1.10% vs -3.59% in Mar 2025
YoY Growth in quarter ended Mar 2026 is 115.81% vs -2,156.25% in Mar 2025
Half Yearly Results Snapshot (Standalone) - Sep'25

Growth in half year ended Sep 2025 is -11.54% vs -7.20% in Sep 2024
Growth in half year ended Sep 2025 is -92.81% vs 34.21% in Sep 2024
Nine Monthly Results Snapshot (Standalone) - Dec'25
YoY Growth in nine months ended Dec 2025 is -6.57% vs -6.54% in Dec 2024
YoY Growth in nine months ended Dec 2025 is -58.84% vs 101.23% in Dec 2024
Annual Results Snapshot (Standalone) - Mar'26
YoY Growth in year ended Mar 2026 is -5.21% vs -5.81% in Mar 2025
YoY Growth in year ended Mar 2026 is 9,450.00% vs -101.12% in Mar 2025
About Innovative Tech Pack Ltd

Company Coordinates


