
Compare Innovision with Similar Stocks
Stock DNA
Diversified Commercial Services
INR 695 Cr (Micro Cap)
20.00
32
0.00%
-0.31
12.64%
2.31
Total Returns (Price + Dividend) 
Innovision for the last several years.
Risk Adjusted Returns v/s
Returns Beta

News

Innovision Ltd Technical Momentum Shifts to Mildly Bullish Amid Market Pressure
Innovision Ltd, a micro-cap player in the diversified commercial services sector, has exhibited a subtle but notable shift in its technical momentum, moving from a sideways trend to a mildly bullish stance. Despite a recent dip in price, the stock’s technical indicators suggest emerging strength, contrasting with its underwhelming short-term returns relative to the broader Sensex.
Read full news article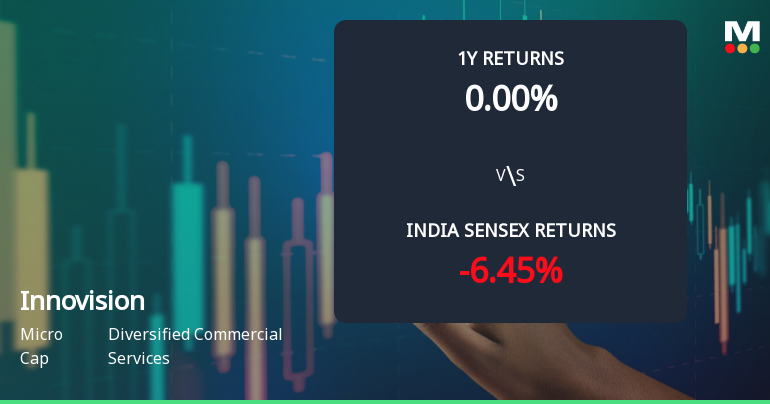
Innovision Ltd Technical Momentum Shifts Amid Sideways Trend
Innovision Ltd, a micro-cap player in the Diversified Commercial Services sector, has exhibited a notable shift in its technical momentum, moving from a mildly bearish stance to a sideways trend. Despite a modest day change of 0.24% to close at ₹297.05, the stock’s technical indicators reveal nuanced signals that investors should carefully analyse amid mixed market returns and sector dynamics.
Read full news article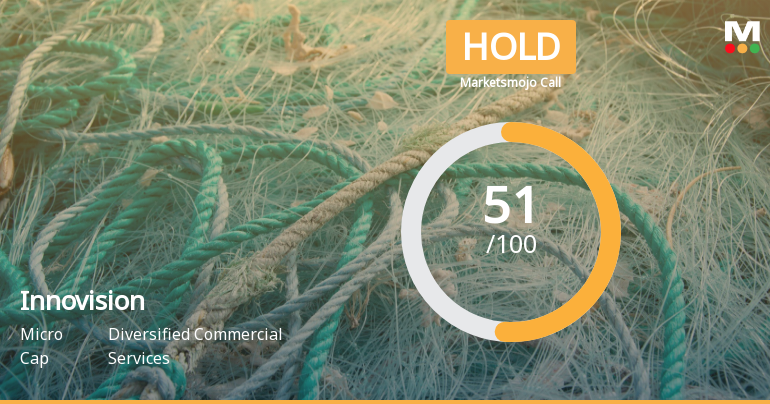
Innovision Ltd is Rated Hold by MarketsMOJO
Innovision Ltd is rated 'Hold' by MarketsMOJO, with this rating last updated on 29 May 2026. While the rating change occurred on that date, the analysis and financial metrics discussed here reflect the stock's current position as of 21 June 2026, providing investors with an up-to-date view of the company’s fundamentals, valuation, financial trends, and technical outlook.
Read full news article Announcements
Corporate Actions

No Upcoming Board Meetings

No Dividend history available

No Splits history available

No Bonus history available

No Rights history available
Quality key factors
Valuation key factors
Technicals key factors
 Technical Indicator Scale: Bearish, Mildly Bearish, Sideways, Mildly Bullish, Bullish Turned
 Shareholding Snapshot : Mar 2026
Shareholding Compare (%holding)
Promoters
None
Held by 0 Schemes
Held by 5 FIIs (2.24%)
Randeep Hundal (37.08%)
Neomile Growth Fund - Series I (4.62%)
10.04%
Quarterly Results Snapshot (Standalone) - Mar'26 - QoQ

QoQ Growth in quarter ended Mar 2026 is 14.16% vs -9.25% in Dec 2025
QoQ Growth in quarter ended Mar 2026 is 159.00% vs -43.85% in Dec 2025
Annual Results Snapshot (Standalone) - Mar'26

YoY Growth in year ended Mar 2026 is 9.68% vs 74.98% in Mar 2025
YoY Growth in year ended Mar 2026 is 22.35% vs 171.20% in Mar 2025
About Innovision Ltd

Company Coordinates


