
Compare Innovision with Similar Stocks
Stock DNA
Diversified Commercial Services
INR 707 Cr (Micro Cap)
19.00
32
0.00%
-0.31
12.64%
2.36
Total Returns (Price + Dividend) 

Risk Adjusted Returns v/s
Returns Beta
News
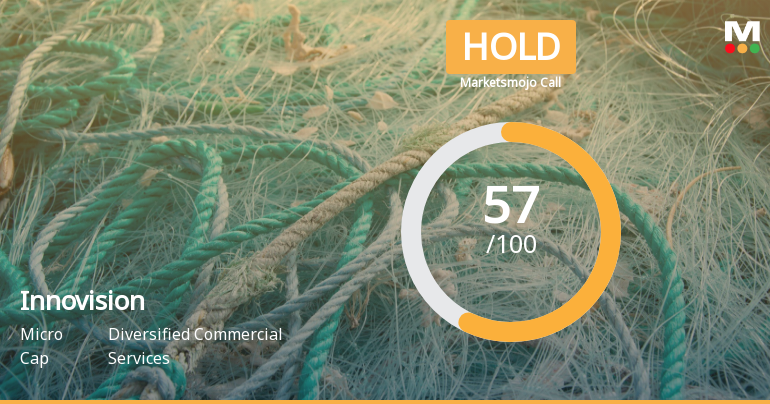
Innovision Ltd is Rated Hold by MarketsMOJO
Innovision Ltd is rated 'Hold' by MarketsMOJO, with this rating last updated on 29 May 2026. While the rating change occurred on that date, the analysis and financial metrics discussed here reflect the stock’s current position as of 10 June 2026, providing investors with an up-to-date view of the company’s fundamentals, valuation, financial trends, and technical outlook.
Read full news article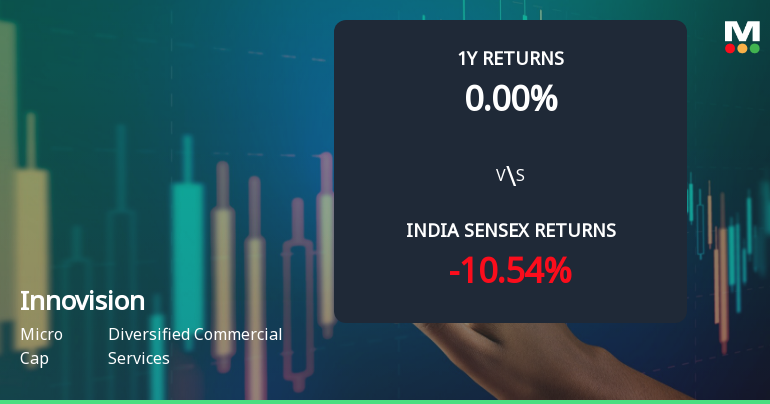
Innovision Ltd Technical Momentum Shifts Amid Sideways Trend
Innovision Ltd, a micro-cap player in the diversified commercial services sector, has experienced a notable shift in its technical momentum, moving from a mildly bearish stance to a sideways trend. Despite a modest day decline of 0.47%, the stock’s technical indicators reveal a complex picture of price momentum and potential near-term stability, warranting close attention from investors and market analysts alike.
Read full news article
Announcements
Announcement under Regulation 30 (LODR)-Award_of_Order_Receipt_of_Order
06-Jun-2026 | Source : BSEIntimation under Regulation 30 of LODR for receiving of work order as user fee collection agency for Belon Fees plaza Uttar Pradesh
Announcement under Regulation 30 (LODR)-Award_of_Order_Receipt_of_Order
04-Jun-2026 | Source : BSEIntimation of work order under regulation 30 Engagement of User fee agency for Mundiyar Toll Plaza wef 11.07.2026
Announcement under Regulation 30 (LODR)-Change in Management
03-Jun-2026 | Source : BSEIntimation under Regulation 30 for change in Management due to Resignation of Whole Time Director Mr. Gurpal Singh wef 03.06.2026
Corporate Actions

No Upcoming Board Meetings

No Dividend history available

No Splits history available

No Bonus history available

No Rights history available
Quality key factors
Valuation key factors
Technicals key factors
 Technical Indicator Scale: Bearish, Mildly Bearish, Sideways, Mildly Bullish, Bullish Turned
 Shareholding Snapshot : Mar 2026
Shareholding Compare (%holding)
Promoters
None
Held by 0 Schemes
Held by 5 FIIs (2.24%)
Randeep Hundal (37.08%)
Neomile Growth Fund - Series I (4.62%)
10.04%
Quarterly Results Snapshot (Standalone) - Mar'26 - QoQ

QoQ Growth in quarter ended Mar 2026 is 14.16% vs -9.25% in Dec 2025
QoQ Growth in quarter ended Mar 2026 is 159.00% vs -43.85% in Dec 2025
Annual Results Snapshot (Standalone) - Mar'26

YoY Growth in year ended Mar 2026 is 9.68% vs 74.98% in Mar 2025
YoY Growth in year ended Mar 2026 is 22.35% vs 171.20% in Mar 2025
About Innovision Ltd

Company Coordinates


