
Compare Insecticid.India with Similar Stocks
Stock DNA
Pesticides & Agrochemicals
INR 1,899 Cr (Small Cap)
14.00
28
0.31%
0.18
12.34%
1.58
Total Returns (Price + Dividend) 
Latest dividend: 2.004 per share ex-dividend date: Feb-06-2026
Risk Adjusted Returns v/s
Returns Beta

News

Insecticides India Ltd Technical Momentum Shifts Amid Bearish Indicators
Insecticides India Ltd, a small-cap player in the Pesticides & Agrochemicals sector, has experienced a notable shift in its technical momentum, moving from a sideways trend to a mildly bearish stance. Despite a marginal day change of 0.06%, key technical indicators such as MACD, Bollinger Bands, and moving averages reveal a complex picture that investors should carefully analyse amid the stock’s recent performance and broader market context.
Read full news article
Insecticides India Ltd is Rated Sell by MarketsMOJO
Insecticides India Ltd is rated Sell by MarketsMOJO, with this rating last updated on 25 May 2026. However, the analysis and financial metrics discussed here reflect the stock's current position as of 09 July 2026, providing investors with the latest insights into the company’s performance and outlook.
Read full news article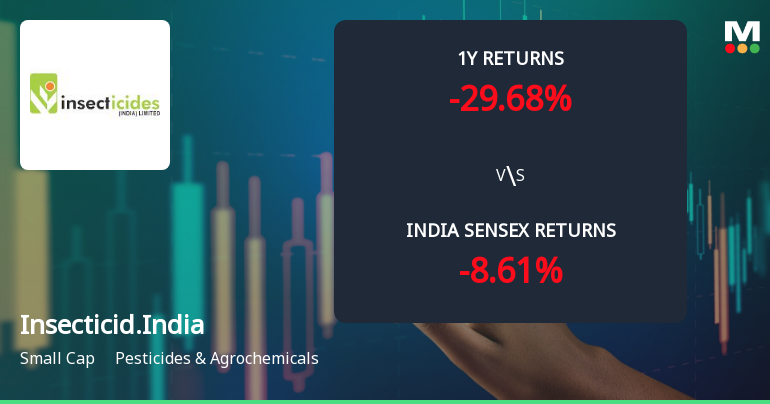
Insecticides India Ltd Technical Momentum Shifts Amid Mixed Market Signals
Insecticides India Ltd has experienced a notable shift in its technical momentum, moving from a mildly bearish stance to a sideways trend, reflecting a complex interplay of technical indicators. Despite a modest day change of 0.10%, the stock’s broader technical signals reveal a nuanced picture for investors navigating the Pesticides & Agrochemicals sector.
Read full news article Announcements
Insecticides (India) Limited - Outcome of Board Meeting
14-Nov-2019 | Source : NSEInsecticides (India) Limited has informed the Exchange regarding Board meeting held on November 13, 2019.
Insecticides (India) Limited - Investor Presentation
13-Nov-2019 | Source : NSEInsecticides (India) Limited has informed the Exchange regarding Investor Presentation
Shareholders meeting
03-Aug-2019 | Source : NSE
| Insecticides (India) Limited has submitted the Exchange a copy Srutinizers report of Annual General Meeting held on August 08, 2018. Further, the company has informed the Exchange regarding voting results. |
Corporate Actions

No Upcoming Board Meetings

Insecticides India Ltd has declared 20% dividend, ex-date: 06 Feb 26

No Splits history available

Insecticides India Ltd has announced 1:2 bonus issue, ex-date: 30 Sep 22

No Rights history available
Quality key factors
Valuation key factors
Technicals key factors
 Technical Indicator Scale: Bearish, Mildly Bearish, Sideways, Mildly Bullish, Bullish Turned
 Shareholding Snapshot : Mar 2026
Shareholding Compare (%holding)
Promoters
None
Held by 2 Schemes (8.93%)
Held by 43 FIIs (4.5%)
Rajesh Kumar Aggarwal (16.63%)
Hdfc Small Cap Fund (9.06%)
11.03%
Quarterly Results Snapshot (Consolidated) - Mar'26 - YoY

YoY Growth in quarter ended Mar 2026 is 18.76% vs 31.71% in Mar 2025
YoY Growth in quarter ended Mar 2026 is -15.69% vs 78.99% in Mar 2025
Half Yearly Results Snapshot (Consolidated) - Sep'25

Growth in half year ended Sep 2025 is 3.51% vs -3.90% in Sep 2024
Growth in half year ended Sep 2025 is 6.06% vs 34.29% in Sep 2024
Nine Monthly Results Snapshot (Consolidated) - Dec'25
YoY Growth in nine months ended Dec 2025 is 4.40% vs -3.09% in Dec 2024
YoY Growth in nine months ended Dec 2025 is -0.14% vs 35.18% in Dec 2024
Annual Results Snapshot (Consolidated) - Mar'26
YoY Growth in year ended Mar 2026 is 7.00% vs 1.71% in Mar 2025
YoY Growth in year ended Mar 2026 is -1.84% vs 38.73% in Mar 2025
About Insecticides India Ltd

Company Coordinates


