
Compare Integra Engg. with Similar Stocks
Dashboard
Negative results in Mar 26
- PAT(Latest six months) At Rs 6.87 cr has Grown at -32.91%
- ROCE(HY) Lowest at 18.61%
- NET SALES(Q) Lowest at Rs 39.73 cr
With ROCE of 18.4, it has a Very Expensive valuation with a 6.1 Enterprise value to Capital Employed
Despite the size of the company, domestic mutual funds hold only 0.53% of the company
Stock DNA
Industrial Manufacturing
INR 746 Cr (Micro Cap)
50.00
86
0.00%
0.16
13.88%
6.82
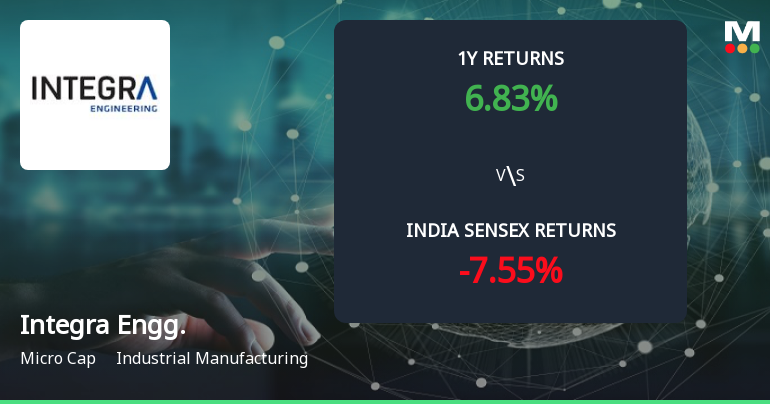
Total Returns (Price + Dividend) 
Integra Engg. for the last several years.
Risk Adjusted Returns v/s
Returns Beta

News
Golden Cross Forms in Integra Engineering India Ltd — On a Day the Stock Gained 1.98%. What the Mixed Signals Mean
The 50-day moving average has crossed above the 200-day moving average for Integra Engineering India Ltd, signalling a golden cross on 12 Jun 2026. Yet, the broader technical and fundamental picture presents a nuanced story that tempers the enthusiasm such a crossover might typically inspire.
Read full news article
Integra Engineering India Ltd Downgraded to Strong Sell Amid Technical and Financial Weakness
Integra Engineering India Ltd has been downgraded from a Sell to a Strong Sell rating as of 1 June 2026, reflecting deteriorating technical indicators and weakening financial performance. The company’s Mojo Score has fallen to 27.0, signalling heightened caution for investors amid a challenging market environment and disappointing quarterly results.
Read full news article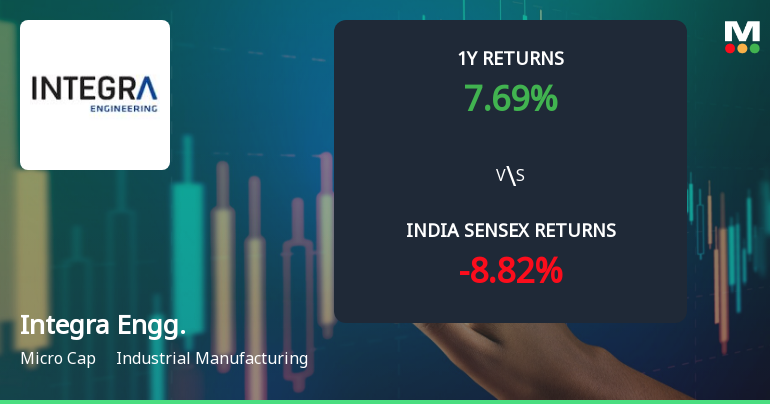
Integra Engineering India Ltd Faces Technical Momentum Shift Amid Mixed Indicator Signals
Integra Engineering India Ltd, a micro-cap player in the industrial manufacturing sector, has experienced a notable shift in its technical momentum, signalling increased bearish tendencies despite some bullish weekly indicators. The stock’s recent price action and technical parameters suggest a complex outlook, with mixed signals from key momentum and trend-following indicators.
Read full news article Announcements
Standalone And Consolidated Audited Financial Results For The Quarter And Year Ended March 31 2026
20-May-2026 | Source : BSEStandalone and Consolidated Audited Financial Results for the quarter and year ended March 31 2026
Board Meeting Outcome for Meeting Of Board Of Directors Held On May 20 2026
20-May-2026 | Source : BSEOutcome of the Board Meeting held on May 20 2026
Compliances-Reg.24(A)-Annual Secretarial Compliance
14-May-2026 | Source : BSEAnnual Secretarial Compliance Report for the year ended March 31 2026
Corporate Actions

No Upcoming Board Meetings

No Dividend history available

No Splits history available

No Bonus history available

No Rights history available
Quality key factors
Valuation key factors
Technicals key factors
 Technical Indicator Scale: Bearish, Mildly Bearish, Sideways, Mildly Bullish, Bullish Turned
 Shareholding Snapshot : Mar 2026
Shareholding Compare (%holding)
Promoters
None
Held by 3 Schemes (0.24%)
Held by 4 FIIs (0.38%)
Integra Holding Ag (54.39%)
None
37.51%
Quarterly Results Snapshot (Consolidated) - Mar'26 - QoQ

QoQ Growth in quarter ended Mar 2026 is -5.88% vs 2.85% in Dec 2025
QoQ Growth in quarter ended Mar 2026 is -1.45% vs -0.29% in Dec 2025
Half Yearly Results Snapshot (Consolidated) - Sep'25

Growth in half year ended Sep 2025 is 12.94% vs 5.23% in Sep 2024
Growth in half year ended Sep 2025 is 3.76% vs 7.99% in Sep 2024
Nine Monthly Results Snapshot (Consolidated) - Dec'25
YoY Growth in nine months ended Dec 2025 is 4.35% vs 8.95% in Dec 2024
YoY Growth in nine months ended Dec 2025 is -16.31% vs 21.40% in Dec 2024
Annual Results Snapshot (Consolidated) - Mar'26
YoY Growth in year ended Mar 2026 is 1.72% vs 12.97% in Mar 2025
YoY Growth in year ended Mar 2026 is -16.60% vs 27.34% in Mar 2025
About Integra Engineering India Ltd

Company Coordinates


