
Compare Integra Essentia with Similar Stocks
Dashboard
With a Operating Losses, the company has a Weak Long Term Fundamental Strength
- Company's ability to service its debt is weak with a poor EBIT to Interest (avg) ratio of 1.06
- The company has been able to generate a Return on Equity (avg) of 5.22% signifying low profitability per unit of shareholders funds
Negative results in Mar 26
Risky - Negative EBITDA
Consistent Underperformance against the benchmark over the last 3 years
Total Returns (Price + Dividend) 
Integra Essentia for the last several years.
Risk Adjusted Returns v/s
Returns Beta

News
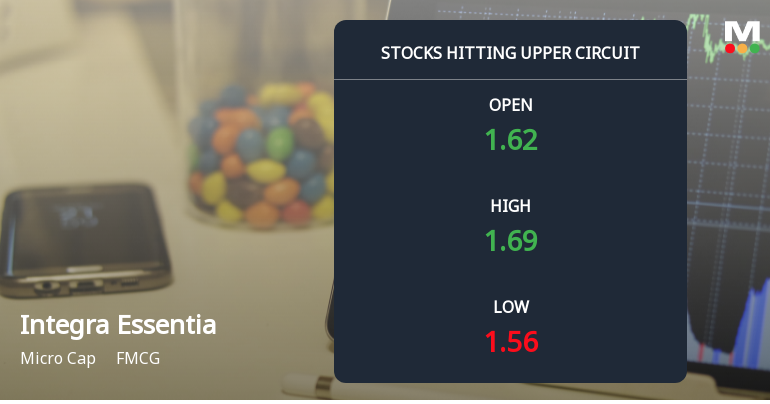
Integra Essentia Ltd Locks at Upper Circuit With 4.85% Gain — Buyers Queue, Sellers Absent
At Rs 1.73, the buying was done — not because demand dried up, but because the exchange wouldn't let the stock go any higher. Integra Essentia Ltd locked at its upper circuit of 4.85% on 1 Jun 2026, with buyers queuing and no sellers willing to part with shares.
Read full news article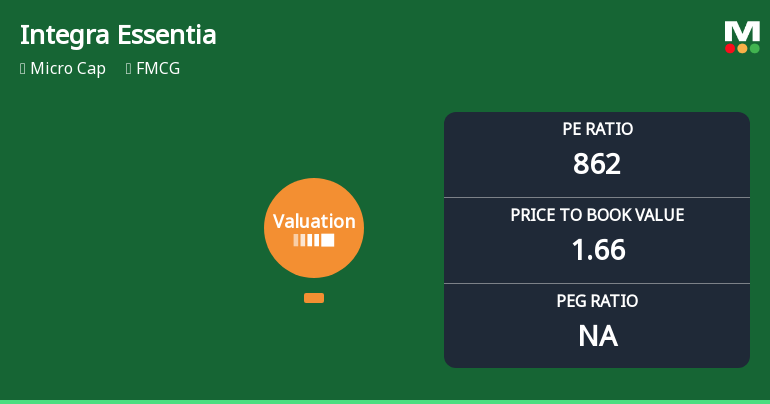
Integra Essentia Ltd Valuation Shifts Signal Elevated Risk Amidst Mixed Market Returns
Integra Essentia Ltd, a micro-cap player in the FMCG sector, has witnessed a significant shift in its valuation parameters, raising concerns about its price attractiveness. With its price-to-earnings (P/E) ratio soaring to an extraordinary 861.7 and a price-to-book value (P/BV) of 1.66, the stock’s valuation grade has deteriorated from 'expensive' to 'risky'. This article analyses these valuation changes in the context of historical trends, peer comparisons, and broader market performance to provide a comprehensive view for investors.
Read full news article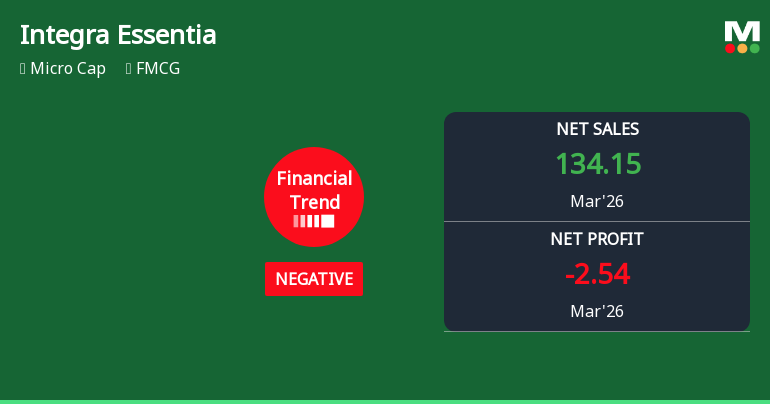
Integra Essentia Ltd Reports Sharp Decline in Profitability Despite Robust Sales Growth
Integra Essentia Ltd, a micro-cap player in the FMCG sector, posted a mixed quarterly performance for March 2026, with net sales surging 34.2% year-on-year to ₹134.15 crores, while profitability metrics deteriorated sharply, signalling mounting operational challenges despite top-line momentum.
Read full news article Announcements
Announcement under Regulation 30 (LODR)-Newspaper Publication
30-May-2026 | Source : BSENewspaper Advertisement for Financial Results quarter and year ended March 31 2026
Compliances-Reg.24(A)-Annual Secretarial Compliance
29-May-2026 | Source : BSESubmission of Annual Secretarial Compliance Report for the Financial Year ended March 31 2026 pursuant to Regulation 24A of the SEBI (Listing Obligations and Disclosure Requirements) Regulations 2015
Resultoutcome Of Board Meeting Audited Financial Results For The Quarter And Financial Year Ended March 31 2026
28-May-2026 | Source : BSEResult Outcome of Board Meeting Audited Financial Results for the quarter and financial year ended March 31 2026
Corporate Actions

No Upcoming Board Meetings

No Dividend history available

Integra Essentia Ltd has announced 1:3 stock split, ex-date: 03 Feb 22

Integra Essentia Ltd has announced 1:1 bonus issue, ex-date: 11 Jan 24

Integra Essentia Ltd has announced 161:250 rights issue, ex-date: 20 May 26
Quality key factors
Valuation key factors
Technicals key factors
 Technical Indicator Scale: Bearish, Mildly Bearish, Sideways, Mildly Bullish, Bullish Turned
 Shareholding Snapshot : Mar 2026
Shareholding Compare (%holding)
Non Institution
None
Held by 7 Schemes (0.0%)
Held by 2 FIIs (0.05%)
Vishesh Gupta (15.98%)
None
78.98%
Quarterly Results Snapshot (Consolidated) - Mar'26 - YoY

YoY Growth in quarter ended Mar 2026 is 34.23% vs 7.11% in Mar 2025

YoY Growth in quarter ended Mar 2026 is -4,980.00% vs -100.84% in Mar 2025
Half Yearly Results Snapshot (Consolidated) - Sep'25
Growth in half year ended Sep 2025 is -8.17% vs 78.15% in Sep 2024
Growth in half year ended Sep 2025 is -38.49% vs -69.58% in Sep 2024
Nine Monthly Results Snapshot (Consolidated) - Dec'25
YoY Growth in nine months ended Dec 2025 is -0.68% vs 85.80% in Dec 2024
YoY Growth in nine months ended Dec 2025 is -26.22% vs -58.70% in Dec 2024
Annual Results Snapshot (Consolidated) - Mar'26
YoY Growth in year ended Mar 2026 is 7.22% vs 59.31% in Mar 2025
YoY Growth in year ended Mar 2026 is -91.67% vs -75.11% in Mar 2025
About Integra Essentia Ltd

Company Coordinates


