
Compare Intense Tech. with Similar Stocks
Stock DNA
Software Products
INR 240 Cr (Micro Cap)
15.00
20
1.03%
-0.43
12.78%
1.83
Total Returns (Price + Dividend) 
Latest dividend: 1 per share ex-dividend date: Sep-23-2025
Risk Adjusted Returns v/s
Returns Beta

News
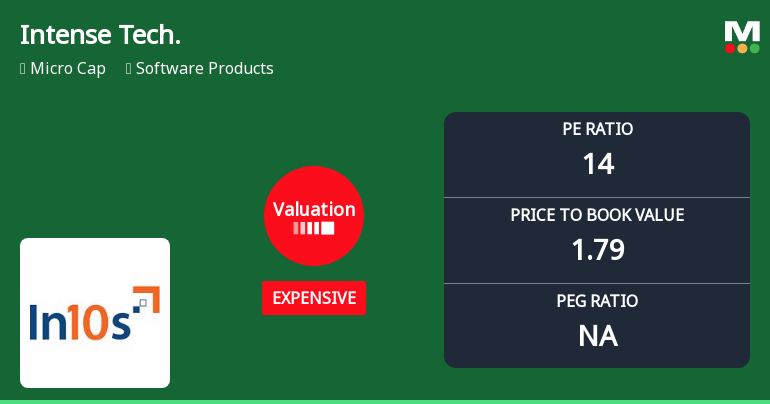
Intense Technologies Ltd Valuation Shifts Amid Mixed Market Performance
Intense Technologies Ltd, a micro-cap player in the Software Products sector, has witnessed a notable shift in its valuation parameters, moving from a very expensive to an expensive rating. This change, coupled with its current price movements and peer comparisons, offers investors a nuanced perspective on its price attractiveness and potential investment appeal amid a challenging market backdrop.
Read full news article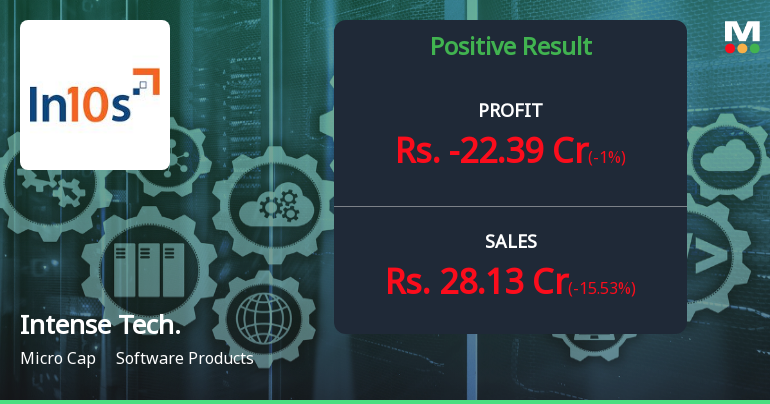
Intense Technologies Q4 FY26: Massive Loss Erases Year's Gains Amid Promoter Exit
Intense Technologies Ltd., a Hyderabad-based software products company, reported a shocking net loss of ₹22.39 crores for Q4 FY26, marking a catastrophic 923.16% year-on-year decline from the ₹2.72 crores profit posted in the corresponding quarter last year. The micro-cap firm, with a market capitalisation of ₹231.00 crores, witnessed its stock decline 2.31% to ₹96.21 following the disastrous results, which completely wiped out the full-year FY25 profit of ₹16.00 crores.
Read full news article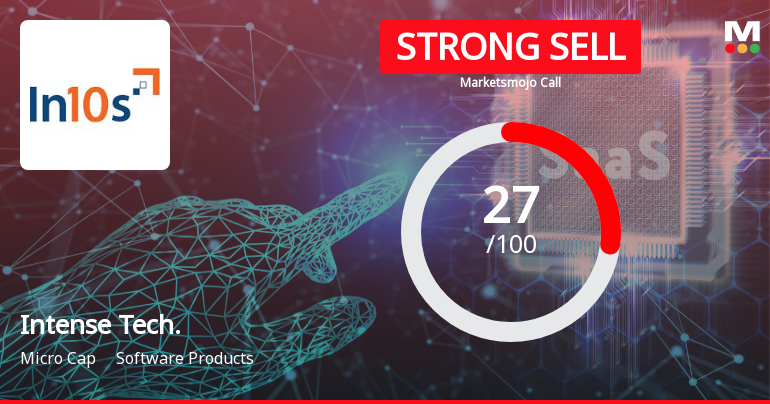
Intense Technologies Ltd Downgraded to Strong Sell Amid Weak Financials and Bearish Technicals
Intense Technologies Ltd, a micro-cap player in the Software Products sector, has been downgraded from a Sell to a Strong Sell rating by MarketsMOJO as of 25 May 2026. This revision reflects deteriorating financial performance, expensive valuation metrics, and a shift towards bearish technical indicators, signalling heightened risk for investors.
Read full news article Announcements
Announcement under Regulation 30 (LODR)-Resignation of Director
08-Jun-2026 | Source : BSEThis is to inform that the Company has received Resignations today i.e. June 8th 2026 from Mr. Jayant Dwarkanath (Executive Director) and Ms. Nishtha Yogesh (Independent Director) to be relieved from Directorship from closing hours of June 8th 2026. Also find attached the Resignation letters received from the Directors
Announcement under Regulation 30 (LODR)-Resignation of Director
04-Jun-2026 | Source : BSEPlease find enclosed the Resignation letter of Mr. Tikam Sujan Non-executive & non-Independent Director with effect from closing of Business Hours of June 3rd 2026 received on June 3rd 2026
Board Meeting Outcome for The Audited Financial Results For The Quarter And Year Ended March 31 2026
29-May-2026 | Source : BSEPlease find enclosed the Audited financial Results for the quarter and year ended March 31 2026 along with Audit report
Corporate Actions

No Upcoming Board Meetings

Intense Technologies Ltd has declared 50% dividend, ex-date: 23 Sep 25

No Splits history available

No Bonus history available

No Rights history available
Quality key factors
Valuation key factors
Technicals key factors
 Technical Indicator Scale: Bearish, Mildly Bearish, Sideways, Mildly Bullish, Bullish Turned
 Shareholding Snapshot : Mar 2026
Shareholding Compare (%holding)
Non Institution
None
Held by 0 Schemes
Held by 2 FIIs (6.89%)
C K Shastri (3.7%)
Yudiz Solutions Limited (10.52%)
58.73%
Quarterly Results Snapshot (Consolidated) - Mar'26 - QoQ

QoQ Growth in quarter ended Mar 2026 is -15.53% vs -0.54% in Dec 2025
QoQ Growth in quarter ended Mar 2026 is -1,065.09% vs -26.81% in Dec 2025
Half Yearly Results Snapshot (Consolidated) - Sep'25
Growth in half year ended Sep 2025 is -21.19% vs 44.48% in Sep 2024
Growth in half year ended Sep 2025 is -57.98% vs 26.29% in Sep 2024
Nine Monthly Results Snapshot (Consolidated) - Dec'25
YoY Growth in nine months ended Dec 2025 is -15.00% vs 37.34% in Dec 2024
YoY Growth in nine months ended Dec 2025 is -50.48% vs 7.76% in Dec 2024
Annual Results Snapshot (Consolidated) - Mar'26
YoY Growth in year ended Mar 2026 is -16.27% vs 30.84% in Mar 2025
YoY Growth in year ended Mar 2026 is -195.89% vs 4.35% in Mar 2025
About Intense Technologies Ltd

Company Coordinates


