
Compare Interarch Build. with Similar Stocks
Dashboard
The company is Net-Debt Free
Poor long term growth as Operating profit has grown by an annual rate 17.78% of over the last 5 years
The company has declared Positive results for the last 5 consecutive quarters
With ROE of 15.5, it has a Very Attractive valuation with a 3.7 Price to Book Value
Falling Participation by Institutional Investors
Stock DNA
Construction
INR 3,227 Cr (Small Cap)
24.00
26
0.65%
-0.09
15.54%
3.66
Total Returns (Price + Dividend) 
Latest dividend: 12.5 per share ex-dividend date: Sep-15-2025
Risk Adjusted Returns v/s
Returns Beta

News

Interarch Building Solutions Ltd Technical Momentum Shifts to Sideways Amid Mixed Signals
Interarch Building Solutions Ltd has experienced a notable shift in its technical momentum, moving from a mildly bearish stance to a more neutral sideways trend. This change is underscored by mixed signals from key technical indicators such as MACD, RSI, and moving averages, reflecting a complex market sentiment for the construction sector player.
Read full news article
Interarch Building Solutions Ltd is Rated Sell
Interarch Building Solutions Ltd is rated Sell by MarketsMOJO, with this rating last updated on 08 June 2026. However, the analysis and financial metrics discussed here reflect the stock’s current position as of 15 June 2026, providing investors with the latest insights into the company’s fundamentals, valuation, financial trends, and technical outlook.
Read full news article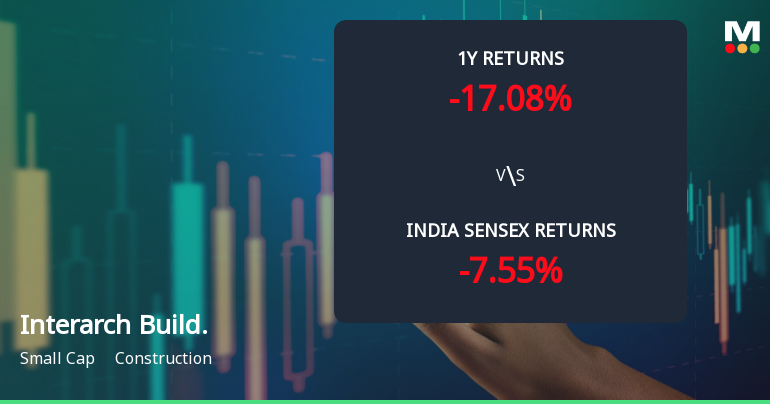
Interarch Building Solutions Ltd Sees Mixed Technical Signals Amid Price Momentum Shift
Interarch Building Solutions Ltd has experienced a notable shift in its technical parameters, reflecting a complex interplay of momentum indicators and moving averages. Despite a recent 4.45% rise in the stock price to ₹1,796.20, the overall technical outlook remains cautiously bearish, with several indicators signalling mixed trends amid a challenging market environment for the construction sector.
Read full news article Announcements
Corporate Actions

No Upcoming Board Meetings

Interarch Building Solutions Ltd has declared 125% dividend, ex-date: 15 Sep 25

No Splits history available

No Bonus history available

No Rights history available
Quality key factors
Valuation key factors
Technicals key factors
 Technical Indicator Scale: Bearish, Mildly Bearish, Sideways, Mildly Bullish, Bullish Turned
 Shareholding Snapshot : Mar 2026
Shareholding Compare (%holding)
Promoters
None
Held by 2 Schemes (1.28%)
Held by 24 FIIs (5.29%)
Arvind Nanda (29.87%)
Pinebridge Global Funds - Pinebridge India Equity Fund (2.88%)
24.65%
Quarterly Results Snapshot (Standalone) - Mar'26 - QoQ

QoQ Growth in quarter ended Mar 2026 is -3.62% vs 6.40% in Dec 2025
QoQ Growth in quarter ended Mar 2026 is -1.77% vs 15.43% in Dec 2025
Half Yearly Results Snapshot (Standalone) - Sep'25

Growth in half year ended Sep 2025 is 39.12% vs 5.95% in Sep 2024
Growth in half year ended Sep 2025 is 48.13% vs 18.46% in Sep 2024
Nine Monthly Results Snapshot (Standalone) - Dec'25
YoY Growth in nine months ended Dec 2025 is 40.80% vs 9.09% in Dec 2024
YoY Growth in nine months ended Dec 2025 is 41.61% vs 22.26% in Dec 2024
Annual Results Snapshot (Standalone) - Mar'26
YoY Growth in year ended Mar 2026 is 30.55% vs 12.41% in Mar 2025
YoY Growth in year ended Mar 2026 is 24.75% vs 25.01% in Mar 2025
About Interarch Building Solutions Ltd

Company Coordinates


