
Compare InterContinental Hotels Group Plc with Similar Stocks
Dashboard
Weak Long Term Fundamental Strength as the company has not declared results in the last 6 months
- Poor long term growth as Net Sales has grown by an annual rate of 11.18% over the last 5 years
- High Debt Company with a Debt to Equity ratio (avg) at times
Risky -
Underperformed the market in the last 1 year
Total Returns (Price + Dividend) 
InterContinental Hotels Group Plc for the last several years.
Risk Adjusted Returns v/s
News

InterContinental Hotels Group Hits Day High with Strong 3.52% Intraday Surge
InterContinental Hotels Group Plc has shown strong recent performance, with notable gains over the past week and month, contrasting with the FTSE 100's decline. However, the company faces challenges such as a high debt-to-equity ratio and modest sales growth, raising concerns about its long-term growth prospects.
Read full news article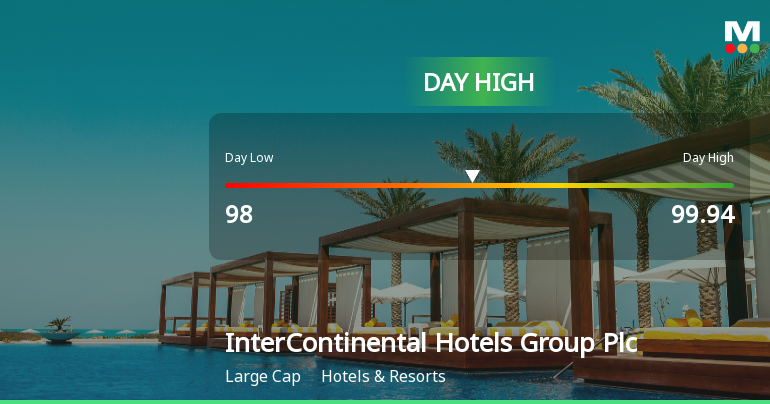
InterContinental Hotels Group Hits Day High with Strong 3.56% Intraday Surge
InterContinental Hotels Group Plc saw a significant rise on November 24, 2025, contrasting with the FTSE 100's modest gain. Over the past month, the company has outperformed the index, although its annual performance lags behind. Challenges include a high debt-to-equity ratio and low sales growth.
Read full news article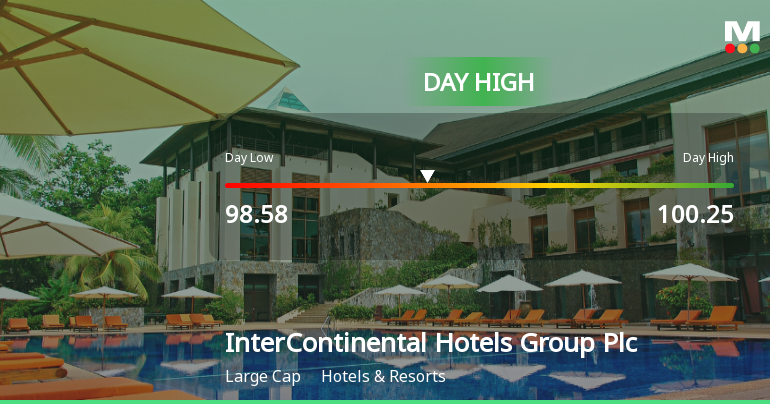
InterContinental Hotels Group Hits Day High with Strong 4.27% Intraday Surge
InterContinental Hotels Group Plc saw a significant intraday increase on November 10, 2025, contrasting with a decline in the FTSE 100. Despite recent gains, the company has faced long-term challenges, with modest annual sales growth and a lower one-year return compared to the index. Its market capitalization is GBP 14,961 million.
Read full news article Announcements

Corporate Actions
Quality key factors
Valuation key factors
Technicals key factors
 Technical Indicator Scale: Bearish, Mildly Bearish, Sideways, Mildly Bullish, Bullish Turned
 Shareholding Snapshot : Jun 2025
Shareholding Compare (%holding)
Foreign Institutions
Held in 0 Schemes (0%)
Held by 5 Foreign Institutions (0.87%)
Quarterly Results Snapshot (Consolidated) - Dec'12 - YoY

YoY Growth in quarter ended Dec 2012 is 7.32% vs 3.68% in Dec 2011

YoY Growth in quarter ended Dec 2012 is -24.60% vs 157.14% in Dec 2011
Annual Results Snapshot (Consolidated) - Dec'24
YoY Growth in year ended Dec 2024 is 6.47% vs 18.81% in Dec 2023
YoY Growth in year ended Dec 2024 is -16.27% vs 99.47% in Dec 2023
About InterContinental Hotels Group Plc

Company Coordinates


