
Compare Intl. Combustion with Similar Stocks
Stock DNA
Industrial Manufacturing
INR 115 Cr (Micro Cap)
NA (Loss Making)
35
0.83%
-0.01
-1.43%
0.88
Total Returns (Price + Dividend) 
Latest dividend: 4 per share ex-dividend date: Sep-03-2025
Risk Adjusted Returns v/s
Returns Beta

News
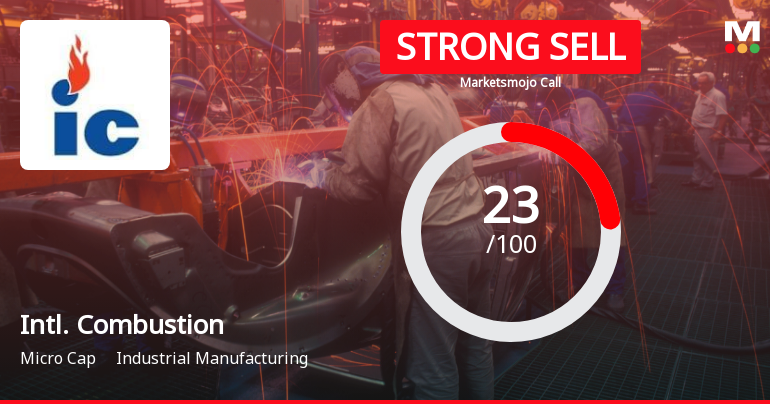
International Combustion (India) Ltd Downgraded to Strong Sell Amid Deteriorating Fundamentals
International Combustion (India) Ltd has been downgraded from a Sell to a Strong Sell rating as of 29 May 2026, reflecting deteriorating valuation metrics, weakening financial trends, and subdued technical indicators. The micro-cap industrial manufacturing company faces mounting challenges amid negative profitability and risky valuation parameters, prompting a reassessment of its investment appeal.
Read full news article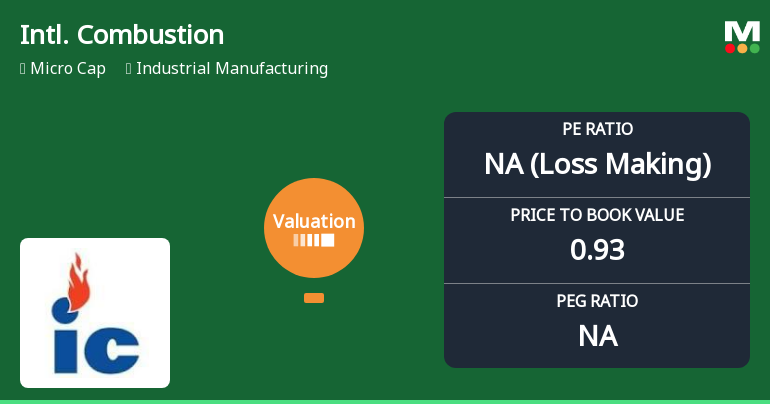
International Combustion (India) Ltd: Valuation Shifts Signal Heightened Risk Amidst Mixed Returns
International Combustion (India) Ltd, a micro-cap player in the industrial manufacturing sector, has seen its valuation parameters deteriorate sharply, prompting a downgrade to a Strong Sell rating. With a current price of ₹509.00 and a market cap reflecting its micro-cap status, the company’s price-to-earnings (P/E) ratio and other key valuation metrics now signal heightened risk compared to both historical levels and peer averages.
Read full news article
International Combustion (India) Ltd is Rated Sell
International Combustion (India) Ltd is rated 'Sell' by MarketsMOJO, with this rating last updated on 15 May 2026. However, the analysis and financial metrics discussed here reflect the stock's current position as of 29 May 2026, providing investors with an up-to-date view of the company's fundamentals, returns, and market performance.
Read full news article Announcements
Announcement under Regulation 30 (LODR)-Newspaper Publication
29-May-2026 | Source : BSECopy of Newspaper publication regarding Audited Financial Results (Standalone) for the Quarter and Year ended 31st March 2026 published in Business Standard (English - All Edition) and Ei Samay (Bengali) on Friday 29th May 2026.
Board Meeting Outcome for Outcome Of Board Meeting Held Today I.E. 28Th May 2026
28-May-2026 | Source : BSEPursuant to Regulation 30 of the Securities and Exchange Board of India (Listing Obligations and Disclosure Requirements) Regulations 2015 as amended (SEBI Listing Regulations) we wish to inform you that the Board of Directors of the Company at its meeting held today i.e. on 28th May 2026 has inter alia considered and approved the following: 1. Audited Financial Results (Standalone) for the quarter and financial year ended 31st March 2026. 2. The Board of Directors has not recommended any dividend for the financial year 2025-26. 3. Re-appointment of Internal Auditors and Tax Auditors 4. Convening of the 90th Annual General Meeting (AGM) of the Company on Wednesday 19th August 2026 at 2:00 P.M. (IST) through Video Conferencing (VC)/Other Audio-Visual Means (OAVM).
Audited Financial Results (Standalone) Of The Company For The Quarter And Financial Year Ended 31St March 2026
28-May-2026 | Source : BSEAudited Financial Results (Standalone) for the Quarter and year ended 31.03.2026
Corporate Actions

No Upcoming Board Meetings

International Combustion (India) Ltd has declared 40% dividend, ex-date: 03 Sep 25

No Splits history available

No Bonus history available

No Rights history available
Quality key factors
Valuation key factors
Technicals key factors
 Technical Indicator Scale: Bearish, Mildly Bearish, Sideways, Mildly Bullish, Bullish Turned
 Shareholding Snapshot : Mar 2026
Shareholding Compare (%holding)
Promoters
None
Held by 0 Schemes
Held by 0 FIIs
Tradelink Securities Limited (14.38%)
Popatlal Punamchand Shah (1.34%)
39.83%
Quarterly Results Snapshot (Standalone) - Mar'26 - YoY

YoY Growth in quarter ended Mar 2026 is -0.96% vs 6.84% in Mar 2025
YoY Growth in quarter ended Mar 2026 is -84.09% vs 83.51% in Mar 2025
Half Yearly Results Snapshot (Standalone) - Sep'25

Growth in half year ended Sep 2025 is 9.61% vs -13.22% in Sep 2024
Growth in half year ended Sep 2025 is -140.91% vs -81.56% in Sep 2024
Nine Monthly Results Snapshot (Standalone) - Dec'25
YoY Growth in nine months ended Dec 2025 is 0.61% vs -4.34% in Dec 2024
YoY Growth in nine months ended Dec 2025 is -142.45% vs -49.85% in Dec 2024
Annual Results Snapshot (Standalone) - Mar'26
YoY Growth in year ended Mar 2026 is 0.14% vs -1.28% in Mar 2025
YoY Growth in year ended Mar 2026 is -115.99% vs -25.06% in Mar 2025
About International Combustion (India) Ltd

Company Coordinates


