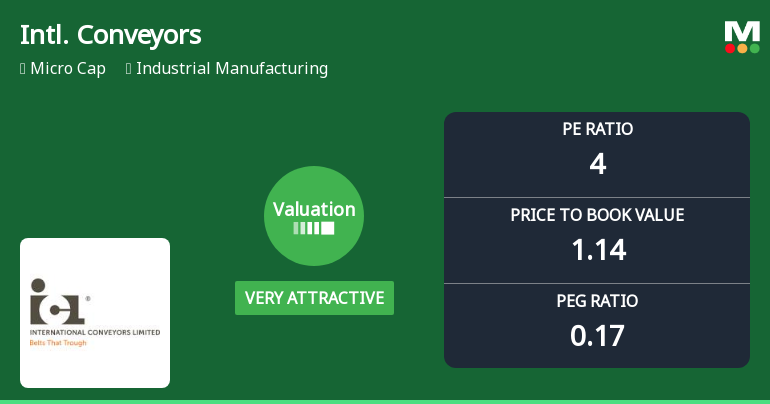
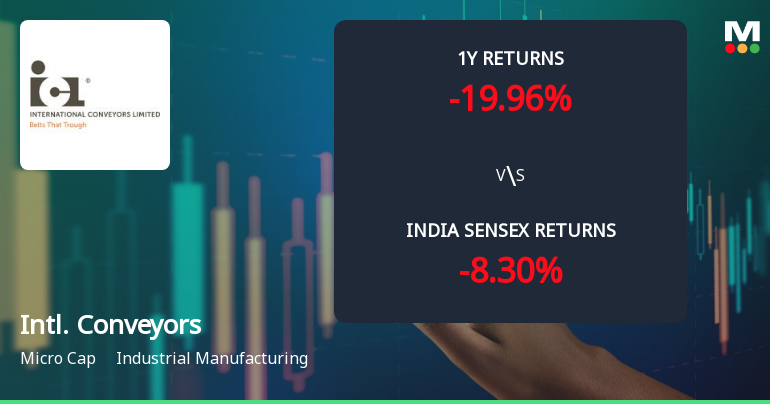
Intl. Conveyors

  • Market Cap: Micro Cap
  • Industry: Industrial Manufacturing
  • ISIN: INE575C01027
  • NSEID: INTLCONV
  • BSEID: 509709
INR
76.46
0.27 (0.35%)
BSENSE

Sep 18, 03:30 PM

BSE+NSE Vol: 19.55 k

  • Price Points
  • Score
  • Mojo Parameters
  • Total Return
  • News and Corporate Actions
  • Key factors
  • Shareholding
  • Financials
  • CompanyCV
stock-summaryPrice Point
High/Low

1Day

52 Week

Valuation
Technical
Day's Volume

CASH

19.55 k (-34.15%) Volume

Shareholding (Jun 2026)

FII

0.62%

Held by 4 FIIs

DII

0.52%

Held by 0 DIIs

Promoter

70.23%

Why is International Conveyors Ltd falling/rising?

06-Sep-2026

As of 05-Sep, the stock price of International Conveyors Ltd is rising to Rs 81.11, supported by strong performance against benchmarks and favorable moving averages. Despite a decline in investor participation, the stock remains liquid, indicating ongoing investor interest.

As of 05-Sep, the stock price of International Conveyors Ltd is rising, currently at Rs 81.11, reflecting an increase of Rs 1.5 or 1.88%. This upward movement is supported by several factors. Over the past week, the stock has outperformed the benchmark Sensex, gaining 0.53% while the Sensex declined by 0.97%. Additionally, in the last month, the stock has risen by 7.96%, contrasting with a 2.44% drop in the Sensex.<BR><BR>Today's trading performance indicates that the stock has outperformed its sector by 1.84%, and it reached an intraday high of Rs 83.5, marking a significant increase of 4.89%. Furthermore, International Conveyors Ltd is trading above its moving averages across various time frames, including the 5-day, 20-day, 50-day, 100-day, and 200-day averages, which typically signals a bullish trend.<BR><BR>However, it is important to note that there has been a decline in investor participation, with delivery volume dropping by 67.85% compared to the 5-day average. Despite this decrease in participation, the stock remains liquid enough for trading, indicating that there is still interest among investors.<BR><BR>Overall, the combination of recent price gains, outperformance against benchmarks, and favorable moving averages contributes to the rising stock price of International Conveyors Ltd.

View full answer

Who are in the management team of Intl. Conveyors?

01-Sep-2026

The management team of Intl. Conveyors includes Managing Director R K Dabriwala, Executive Director P. S. Deshpande, Company Secretary Dipti Sharma, Directors Udit Sethia and Surbhit Dabriwala, along with five Independent Directors. This team is responsible for the company's governance and strategic direction.

The management team of Intl. Conveyors includes the following individuals:<BR><BR>1. **R K Dabriwala** - Managing Director<BR>2. **P. S. Deshpande** - Executive Director<BR>3. **Dipti Sharma** - Company Secretary & Compliance Officer<BR>4. **Udit Sethia** - Director<BR>5. **Surbhit Dabriwala** - Director<BR><BR>Additionally, there are several Independent Directors on the board:<BR><BR>1. **Mahadeo Prasad Jhunjhunwala** - Independent Director<BR>2. **J S Vanzara** - Independent Director<BR>3. **K T Reddy** - Independent Director<BR>4. **Sunit Mehra** - Independent Director<BR>5. **Jayanthi Talluri** - Independent Director<BR><BR>This team plays a crucial role in the governance and strategic direction of the company.

View full answer

What does Intl. Conveyors do?

01-Sep-2026

International Conveyors Ltd manufactures PVC conveyor belt solutions for the mining sector and various industries. As of June 2026, it reported net sales of 35 Cr and a net profit of 120 Cr, with a market cap of INR 518 Cr.

Overview: <BR>International Conveyors Ltd is engaged in manufacturing Polyvinyl Chloride (PVC) Conveyor Belt solutions for the mining sector and various industries, operating within the Industrial Manufacturing sector as a Micro Cap company.<BR><BR>History: <BR>International Conveyors Limited was incorporated in 1973 by entrepreneur Mr. R.K. Dabriwala. The latest quarterly results reported net sales and net profit for June 2026.<BR><BR>Financial Snapshot: <BR>Net Sales: 35 Cr (Quarterly Results - Jun 2026) <BR>Net Profit: 120 Cr (Quarterly Results - Jun 2026) <BR>Market Cap: INR 518 Cr (Micro Cap)<BR><BR>Key Metrics: <BR>P/E: 4.00 <BR>Industry P/E: 35 <BR>Dividend Yield: 0.93% <BR>Debt Equity: -0.53 <BR>Return on Equity: 16.11% <BR>Price to Book: 1.20 <BR><BR>Contact Details: <BR>Address: FaltaSEZ Sector2 Nr Pump House, No 3 Village & Mouza-Akalmegh Kolkata West Bengal : 743504 <BR>Email: icltd@iclbelting.com <BR>Website: http://www.iclbelting.com

View full answer

Who are the peers of the Intl. Conveyors?

01-Sep-2026

Intl. Conveyors' peers include Artson, Mazda, Fabtech Cleanroo, Bemco Hydraulics, Guj Apollo Inds, United Drilling, GP Eco Solutions, and Ganesh Green. Key metrics show average management risk and growth for Intl. Conveyors, with a 1-year return of -7.83%, better than Bemco Hydraulics but worse than United Drilling's 10.82%.

Peers: The peers of Intl. Conveyors are Artson, Mazda, Fabtech Cleanroo, Bemco Hydraulics, Guj Apollo Inds, United Drilling, GP Eco Solutions, and Ganesh Green.<BR><BR>Quality Snapshot: Excellent management risk is observed at Mazda, while Average management risk is found at Artson, Intl. Conveyors, Bemco Hydraulics, Guj Apollo Inds, United Drilling, GP Eco Solutions, and Ganesh Green. Below Average management risk is noted for Fabtech Cleanroo. Growth is Excellent at GP Eco Solutions and Ganesh Green, while Average growth is seen at Artson, Intl. Conveyors, Mazda, Fabtech Cleanroo, Bemco Hydraulics, Guj Apollo Inds, and United Drilling. Below Average growth is reported for all peers except GP Eco Solutions and Ganesh Green. Capital Structure is Excellent at Mazda and Fabtech Cleanroo, Good at Intl. Conveyors and Bemco Hydraulics, and Below Average at Guj Apollo Inds.<BR><BR>Return Snapshot: The peer with the highest 1-year return is United Drilling at 10.82%, while the peer with the lowest is Bemco Hydraulics at -32.02%. Intl. Conveyors has a 1-year return of -7.83%, which is better than Bemco Hydraulics but worse than United Drilling. Additionally, Guj Apollo Inds and Bemco Hydraulics have negative six-month returns.

View full answer

How big is Intl. Conveyors?

01-Sep-2026

As of 31st August, International Conveyors Ltd has a market capitalization of 518.00 Cr, with recent Net Sales of 212.99 Cr and a Net Profit of 136.13 Cr. Shareholder's Funds are 361.80 Cr and Total Assets amount to 507.86 Cr as of March 2025.

As of 31st August, International Conveyors Ltd has a market capitalization of 518.00 Cr, categorizing it as a Micro Cap company.<BR><BR>In the latest four quarters, the company reported Net Sales of 212.99 Cr and a Net Profit of 136.13 Cr.<BR><BR>The latest annual period for the balance sheet is March 2025, with Shareholder's Funds amounting to 361.80 Cr and Total Assets of 507.86 Cr.

View full answer

Should I buy, sell or hold International Conveyors Ltd?

20-Aug-2026

Are International Conveyors Ltd latest results good or bad?

21-May-2026

International Conveyors Ltd's latest results show strong revenue growth of 77.71% year-on-year, reaching ₹97.03 crores, but a concerning 69.38% drop in net profit to ₹3.99 crores due to negative other income raises questions about the sustainability of its earnings. While operating margins remain stable, the significant profit decline despite revenue growth is a red flag for investors.

International Conveyors Ltd's latest results present a mixed picture. On one hand, the company achieved impressive revenue growth, with net sales soaring by 77.71% year-on-year to ₹97.03 crores in Q4 FY26. This strong performance indicates robust demand for its conveyor belting products, particularly in the mining and manufacturing sectors.<BR><BR>However, the profitability aspect raises significant concerns. The net profit for the same quarter plummeted by 69.38% year-on-year to ₹3.99 crores, a stark decline that overshadowed the revenue growth. This drop in profit was primarily driven by a negative other income of ₹10.45 crores, which marked a significant reversal from the previous year. The volatility in other income has become a critical issue, leading to questions about the sustainability of the company's earnings.<BR><BR>While the operating profit before depreciation, interest, and tax (PBDIT) excluding other income reached its highest level at ₹18.63 crores, the overall profit decline despite strong revenue growth suggests that the quality of earnings is in question. The company's operating margin remained relatively stable at 19.20%, indicating disciplined cost management despite inflationary pressures.<BR><BR>In summary, while International Conveyors Ltd has demonstrated strong operational performance and revenue growth, the sharp decline in net profit due to volatile other income raises red flags for investors regarding the sustainability and quality of its earnings.

View full answer

When is the next results date for International Conveyors Ltd?

15-May-2026

The next results date for International Conveyors Ltd is 20 May 2026.

The next results date for International Conveyors Ltd is scheduled for 20 May 2026.

View full answer

Is Intl. Conveyors overvalued or undervalued?

17-Nov-2025

As of November 14, 2025, Intl. Conveyors is considered overvalued with a valuation grade of expensive, reflected by a PE ratio of 5.12 and an EV to EBITDA of 17.70, despite a strong five-year return of 207.48%, as it has underperformed the Sensex recently.

As of 14 November 2025, the valuation grade for Intl. Conveyors has moved from very expensive to expensive. The company is currently considered overvalued based on its financial metrics. Key ratios include a PE ratio of 5.12, an EV to EBITDA of 17.70, and a PEG ratio of 0.13, which suggests that, despite a low PE, the overall valuation remains high relative to its earnings growth potential.<BR><BR>In comparison to peers, Intl. Conveyors has a significantly lower PE ratio than Rail Vikas, which stands at 58.94, and Tube Investments, which is at 94.36. However, the EV to EBITDA ratio of 17.70 is still on the higher side compared to the industry, indicating that the stock may not be as attractive as it appears. Furthermore, while Intl. Conveyors has shown a strong return over the past five years at 207.48%, it has underperformed the Sensex in the last year and over the last month, reinforcing the notion that the current valuation may not be justified.

View full answer

How has been the historical performance of Intl. Conveyors?

14-Nov-2025

Intl. Conveyors has shown fluctuating historical performance, with net sales increasing to 151.85 Cr in March 2025 from 133.93 Cr in March 2024, and significant improvements in operating profit and profit after tax. The company has demonstrated a recovery in profitability and operational efficiency in the latest fiscal year.

Answer:<BR>The historical performance of Intl. Conveyors shows a fluctuating trend in net sales and profits over the years, with a notable increase in recent periods.<BR><BR>Breakdown:<BR>Intl. Conveyors reported net sales of 151.85 Cr for the year ending March 2025, up from 133.93 Cr in March 2024, but down from 215.02 Cr in March 2023. The total operating income mirrored this trend, reaching 151.85 Cr in March 2025, compared to 133.93 Cr in the previous year and 215.02 Cr in March 2023. The company’s total expenditure, excluding depreciation, was 130.38 Cr in March 2025, an increase from 112.64 Cr in March 2024, but significantly lower than 185.63 Cr in March 2023. Operating profit (PBDIT) for March 2025 was 126.43 Cr, a substantial rise from 87.92 Cr in March 2024, and a marked improvement from 43.36 Cr in March 2023. Profit before tax also saw a significant increase to 116.27 Cr in March 2025 from 77.03 Cr in March 2024, while profit after tax rose to 91.71 Cr from 62.39 Cr in the prior year. The company’s total assets increased to 507.86 Cr in March 2025 from 439.24 Cr in March 2024, and total liabilities also rose to 507.86 Cr from 439.24 Cr. Cash flow from operating activities improved to 14.00 Cr in March 2025, compared to 12.00 Cr in March 2024, while cash flow from investing activities showed a positive shift to 43.00 Cr in March 2025 from a negative 47.00 Cr in March 2024. Overall, Intl. Conveyors has demonstrated a recovery in profitability and operational efficiency in the latest fiscal year.

View full answer

Is Intl. Conveyors technically bullish or bearish?

27-Oct-2025

As of October 24, 2025, the trend is mildly bullish due to a bullish MACD and moving averages, but mixed signals from the RSI and KST suggest a cautious outlook.

As of 24 October 2025, the technical trend has changed from bullish to mildly bullish. The current stance is mildly bullish, driven by a bullish MACD on both weekly and monthly time frames, and a bullish signal from the daily moving averages. However, the monthly RSI indicates bearish momentum, and the KST shows a mildly bearish signal on both weekly and monthly time frames. The Bollinger Bands are bullish weekly and mildly bullish monthly, while the Dow Theory suggests a mildly bullish stance on the monthly chart. Overall, the mixed signals indicate a cautious bullish outlook.

View full answer

Who are the top shareholders of the Intl. Conveyors?

06-Jun-2025

The top shareholder of Intl. Conveyors is I G E (India) Private Limited, holding 50.02%. Other notable shareholders include Deepshikha Khaitan with 1.18% and individual investors collectively owning 27.96%.

The top shareholders of Intl. Conveyors include I G E (India) Private Limited, which holds the largest stake at 50.02%. The company has no pledged promoter holdings, and there are three Foreign Institutional Investors (FIIs) holding a total of 0.02%. The highest public shareholder is Deepshikha Khaitan, with a holding of 1.18%. Additionally, individual investors collectively hold 27.96% of the company's shares.

View full answer

What is the bonus history of the Intl. Conveyors?

06-Jun-2025

Intl. Conveyors issued a 1:1 bonus on December 10, 2009, with a record date of December 11, 2009, allowing shareholders to receive an additional share for each share owned.

Intl. Conveyors has a bonus history that includes a notable 1:1 bonus issue announced on December 10, 2009. The record date for this bonus was December 11, 2009. This means that shareholders on record as of that date received an additional share for every share they owned. If you have any more questions about the company or its financial activities, feel free to ask!

View full answer

Has Intl. Conveyors declared dividend?

06-Jun-2025

International Conveyors Ltd has declared a 110% dividend (₹1.1 per share) with an ex-date of September 20, 2024. While recent returns have been volatile, the company has shown significant long-term growth, with a total return of 285.12% over the last five years.

International Conveyors Ltd has declared a 110% dividend.<BR><BR>Dividend Details:<BR>- Percentage announced: 110%<BR>- Amount per share: 1.1<BR>- Ex-date: 20 Sep 24<BR><BR>Dividend Yield: 1.37%.<BR><BR>Total Returns by Period:<BR>Over the last 6 months, the price return was -6.59%, with a dividend return of 0%, resulting in a total return of -6.59%.<BR><BR>In the 1-year period, the price return was 3.07%, the dividend return was 1.38%, leading to a total return of 4.45%.<BR><BR>For the 2-year period, the price return was 34.11%, with a dividend return of 3.00%, resulting in a total return of 37.11%.<BR><BR>During the 3-year period, the price return was 31.43%, the dividend return was 5.78%, culminating in a total return of 37.21%.<BR><BR>Over the last 4 years, the price return was 51.04%, with a dividend return of 6.43%, leading to a total return of 57.47%.<BR><BR>In the 5-year period, the price return was 268.0%, the dividend return was 17.12%, resulting in a total return of 285.12%.<BR><BR>Overall, International Conveyors Ltd has declared a substantial dividend, and while recent returns have shown some volatility, the long-term performance indicates significant growth, particularly in the last five years.

View full answer
iScoreScore
Click here to find our call on this stock
Strong Sell
Sell
Hold
Buy
Strong Buy

Dashboard

1

Poor long term growth as Net Sales has grown by an annual rate of 4.87% and Operating profit at 14.39% over the last 5 years

 
2

72.18% of Promoter Shares are Pledged

3

Below par performance in long term as well as near term

stock-summaryMojo Parameters

Mojo Parameters

Loading Valuation Snapshot...

Stock DNA

stock-summary
Industry

Industrial Manufacturing

stock-summary
Market cap

INR 490 Cr (Micro Cap)

stock-summary
P/E

4.00

stock-summary
Industry P/E

34

stock-summary
Dividend Yield

1.56%

stock-summary
Debt Equity

-0.53

stock-summary
Return on Equity

16.11%

stock-summary
Price to Book

1.20

Revenue and Profits:
Net Sales:
35 Cr
(Quarterly Results - Jun 2026)
Net Profit:
120 Cr
stock-summaryTotal Returns
Total Returns (Price + Dividend) stock-summary
Dividend Yield (1.56%)
TimePeriod
Price Return
Dividend Return
Total Return
3 Months
-7.29%
0.57%
-6.72%
6 Months
9.56%
0.73%
10.29%
1 Year
-20.93%
0.46%
-20.47%
2 Years
-16.93%
1.23%
-15.7%
3 Years
-8.78%
2.84%
-5.94%
4 Years
25.34%
5.90%
31.24%
5 Years
4.67%
6.46%
11.13%

Latest dividend: 0.4773809523809524 per share ex-dividend date: Sep-17-2026

Risk Adjusted Returns v/s stock-summary
Returns Beta
Icon
Beta has not been calculated since enough price history is not available
stock-summaryNews & Corporate Actions

News

Announcements stock-summary

Reconstitution Of Stakeholders Relationship Committee

11-Sep-2026 | Source : BSE

Intimation of Reconstitution of Stakeholders Relationship Committee under Regulation 30 of SEBI (Listing Obligations and Disclosure Requirements) Regulations 2015

Announcement under Regulation 30 (LODR)-Newspaper Publication

03-Sep-2026 | Source : BSE

Copy of Newspaper Publication published on 03.09.2026 regarding notice of 53rd Annual General Meeting.

Notice Of 53Rd Annual General Meeting

02-Sep-2026 | Source : BSE

Notice of 53rd AGM scheduled to be held on Thursday September 24 2026 at 2:00 P.M. at the registered office of the Company at Falta Sez Sector II Near Pump House No 3 Village & Mouza-Akalmegh South 24 Parganas-743504

Corporate Actions stock-summary

stock-summary
BOARD MEETING

No Upcoming Board Meetings

stock-summary
DIVIDEND

International Conveyors Ltd has declared 50% dividend, ex-date: 17 Sep 26

stock-summary
SPLITS

International Conveyors Ltd has announced 1:10 stock split, ex-date: 10 Dec 09

stock-summary
BONUS

International Conveyors Ltd has announced 1:1 bonus issue, ex-date: 10 Dec 09

stock-summary
RIGHTS

No Rights history available

stock-summaryKey Factors

Quality key factors stock-summary

Factor
Value
Sales Growth (5y)
4.87%
EBIT Growth (5y)
14.39%
EBIT to Interest (avg)
3.86
Debt to EBITDA (avg)
3.40
Net Debt to Equity (avg)
-0.53
Sales to Capital Employed (avg)
0.54
Tax Ratio
20.75%
Dividend Payout Ratio
5.18%
Pledged Shares
72.18%
Institutional Holding
1.14%
ROCE (avg)
10.92%
ROE (avg)
17.03%

Valuation key factors

Factor
Value
P/E Ratio
4
Industry P/E
34
Price to Book Value
1.15
EV to EBIT
6.56
EV to EBITDA
6.30
EV to Capital Employed
1.31
EV to Sales
1.24
PEG Ratio
0.17
Dividend Yield
0.65%
ROCE (Latest)
19.19%
ROE (Latest)
16.11%

Technicals key factors

Indicator
Weekly
Monthly
MACD
Mildly Bullish
Bearish
RSI
No Signal
No Signal
Bollinger Bands
Bearish
Bearish
Moving Averages
Bearish (Daily)
KST
Bearish
Bearish
Dow Theory
Mildly Bullish
Mildly Bearish
OBV
Mildly Bearish
Mildly Bullish
stock-summary Technical Indicator Scale: Bearish, Mildly Bearish, Sideways, Mildly Bullish, Bullish  Turned 
stock-summaryShareholding
Shareholding Snapshot : Jun 2026stock-summary
Shareholding Compare (%holding) stock-summary
Majority shareholders

Promoters

Pledged Promoter Holdings

72.1758

Mutual Funds

Held by 0 Schemes

FIIs

Held by 4 FIIs (0.62%)

Promoter with highest holding

I G E (india) Private Limited (45.92%)

Highest Public shareholder

Vivek Mundra (1.81%)

Individual Investors Holdings

22.33%

stock-summaryFinancial
[
  {
    "link": "quarterly",
    "btn_text": "All Quarterly Results",
    "header": "Quarterly Results Snapshot (Consolidated) - Jun'26 - QoQ",
    "rhs": [
      {
        "prefix": "Net Sales ",
        "suffix": "QoQ Growth in quarter ended Jun 2026 is -63.60% vs 174.56% in Mar 2026",
        "dir": -1
      },
      {
        "prefix": "Consolidated Net Profit ",
        "suffix": "QoQ Growth in quarter ended Jun 2026 is 2,903.01% vs -86.56% in Mar 2026",
        "dir": 1
      }
    ],
    "table": {
      "header": [
        "Jun'26",
        "Mar'26",
        "Change(%)"
      ],
      "body": [
        {
          "field": "Net Sales",
          "val1": "35.32",
          "val2": "97.03",
          "chgp": "-63.60%",
          "chgp_class": "negative"
        },
        {
          "field": "Operating Profit (PBDIT) excl Other Income",
          "val1": "7.12",
          "val2": "18.63",
          "chgp": "-61.78%",
          "chgp_class": "negative"
        },
        {
          "field": "Interest",
          "val1": "1.87",
          "val2": "1.84",
          "chgp": "1.63%",
          "chgp_class": "negative"
        },
        {
          "field": "Exceptional Items",
          "val1": "0.00",
          "val2": "0.00",
          "chgp": "",
          "chgp_class": "neutral"
        },
        {
          "field": "Consolidate Net Profit",
          "val1": "119.82",
          "val2": "3.99",
          "chgp": "2,903.01%",
          "chgp_class": "positive"
        },
        {
          "field": "Operating Profit Margin (Excl OI)",
          "val1": "20.16%",
          "val2": "19.20%",
          "chgp": "0.96%",
          "chgp_class": "positive"
        }
      ]
    }
  },
  {
    "link": "half-yearly",
    "btn_text": "All Half Yearly Results",
    "header": "Half Yearly Results Snapshot (Consolidated) - Sep'25",
    "rhs": [
      {
        "prefix": "Net Sales ",
        "suffix": " Growth in half year ended Sep 2025 is 13.49% vs -16.69% in Sep 2024",
        "dir": 1
      },
      {
        "prefix": "Consolidated Net Profit ",
        "suffix": " Growth in half year ended Sep 2025 is -40.85% vs 58.55% in Sep 2024",
        "dir": -1
      }
    ],
    "table": {
      "header": [
        "Sep'25",
        "Sep'24",
        "Change(%)"
      ],
      "body": [
        {
          "field": "Net Sales",
          "val1": "80.76",
          "val2": "71.16",
          "chgp": "13.49%",
          "chgp_class": "positive"
        },
        {
          "field": "Operating Profit (PBDIT) excl Other Income",
          "val1": "16.22",
          "val2": "10.57",
          "chgp": "53.45%",
          "chgp_class": "positive"
        },
        {
          "field": "Interest",
          "val1": "4.51",
          "val2": "4.93",
          "chgp": "-8.52%",
          "chgp_class": "positive"
        },
        {
          "field": "Exceptional Items",
          "val1": "0.00",
          "val2": "0.00",
          "chgp": "",
          "chgp_class": "neutral"
        },
        {
          "field": "Consolidate Net Profit",
          "val1": "34.71",
          "val2": "58.68",
          "chgp": "-40.85%",
          "chgp_class": "negative"
        },
        {
          "field": "Operating Profit Margin (Excl OI)",
          "val1": "20.08%",
          "val2": "14.85%",
          "chgp": "5.23%",
          "chgp_class": "positive"
        }
      ]
    }
  },
  {
    "link": "nine-monthly",
    "btn_text": "All Nine Monthly Results",
    "header": "Nine Monthly Results Snapshot (Consolidated) - Dec'25",
    "rhs": [
      {
        "prefix": "Net Sales ",
        "suffix": "YoY Growth in nine months ended Dec 2025 is 19.38% vs -9.93% in Dec 2024",
        "dir": 1
      },
      {
        "prefix": "Consolidated Net Profit ",
        "suffix": "YoY Growth in nine months ended Dec 2025 is -18.16% vs 39.70% in Dec 2024",
        "dir": -1
      }
    ],
    "table": {
      "header": [
        "Dec'25",
        "Dec'24",
        "Change(%)"
      ],
      "body": [
        {
          "field": "Net Sales",
          "val1": "116.10",
          "val2": "97.25",
          "chgp": "19.38%",
          "chgp_class": "positive"
        },
        {
          "field": "Operating Profit (PBDIT) excl Other Income",
          "val1": "21.59",
          "val2": "10.95",
          "chgp": "97.17%",
          "chgp_class": "positive"
        },
        {
          "field": "Interest",
          "val1": "6.59",
          "val2": "6.57",
          "chgp": "0.30%",
          "chgp_class": "negative"
        },
        {
          "field": "Exceptional Items",
          "val1": "0.00",
          "val2": "0.00",
          "chgp": "",
          "chgp_class": "neutral"
        },
        {
          "field": "Consolidate Net Profit",
          "val1": "64.39",
          "val2": "78.68",
          "chgp": "-18.16%",
          "chgp_class": "negative"
        },
        {
          "field": "Operating Profit Margin (Excl OI)",
          "val1": "18.60%",
          "val2": "11.26%",
          "chgp": "7.34%",
          "chgp_class": "positive"
        }
      ]
    }
  },
  {
    "link": "annual",
    "btn_text": "All Annual Results",
    "header": "Annual Results Snapshot (Consolidated) - Mar'26",
    "rhs": [
      {
        "prefix": "Net Sales ",
        "suffix": "YoY Growth in year ended Mar 2026 is 40.36% vs 13.38% in Mar 2025",
        "dir": 1
      },
      {
        "prefix": "Consolidated Net Profit ",
        "suffix": "YoY Growth in year ended Mar 2026 is -25.44% vs 46.99% in Mar 2025",
        "dir": -1
      }
    ],
    "table": {
      "header": [
        "Mar'26",
        "Mar'25",
        "Change(%)"
      ],
      "body": [
        {
          "field": "Net Sales",
          "val1": "213.13",
          "val2": "151.85",
          "chgp": "40.36%",
          "chgp_class": "positive"
        },
        {
          "field": "Operating Profit (PBDIT) excl Other Income",
          "val1": "40.22",
          "val2": "21.47",
          "chgp": "87.33%",
          "chgp_class": "positive"
        },
        {
          "field": "Interest",
          "val1": "8.43",
          "val2": "8.42",
          "chgp": "0.12%",
          "chgp_class": "negative"
        },
        {
          "field": "Exceptional Items",
          "val1": "0.00",
          "val2": "0.00",
          "chgp": "",
          "chgp_class": "neutral"
        },
        {
          "field": "Consolidate Net Profit",
          "val1": "68.38",
          "val2": "91.71",
          "chgp": "-25.44%",
          "chgp_class": "negative"
        },
        {
          "field": "Operating Profit Margin (Excl OI)",
          "val1": "18.87%",
          "val2": "14.14%",
          "chgp": "4.73%",
          "chgp_class": "positive"
        }
      ]
    }
  }
]

Quarterly Results Snapshot (Consolidated) - Jun'26 - QoQstock-summary

Jun'26
Mar'26
Change(%)
Net Sales
35.32
97.03
-63.60%
Operating Profit (PBDIT) excl Other Income
7.12
18.63
-61.78%
Interest
1.87
1.84
1.63%
Exceptional Items
0.00
0.00
Consolidate Net Profit
119.82
3.99
2,903.01%
Operating Profit Margin (Excl OI)
20.16%
19.20%
0.96%
Values in Rs Cr.
Direction Arrows
Net Sales

QoQ Growth in quarter ended Jun 2026 is -63.60% vs 174.56% in Mar 2026

Direction Arrows
Consolidated Net Profit

QoQ Growth in quarter ended Jun 2026 is 2,903.01% vs -86.56% in Mar 2026

Half Yearly Results Snapshot (Consolidated) - Sep'25stock-summary

Sep'25
Sep'24
Change(%)
Net Sales
80.76
71.16
13.49%
Operating Profit (PBDIT) excl Other Income
16.22
10.57
53.45%
Interest
4.51
4.93
-8.52%
Exceptional Items
0.00
0.00
Consolidate Net Profit
34.71
58.68
-40.85%
Operating Profit Margin (Excl OI)
20.08%
14.85%
5.23%
Values in Rs Cr.
Direction Arrows
Net Sales

Growth in half year ended Sep 2025 is 13.49% vs -16.69% in Sep 2024

Direction Arrows
Consolidated Net Profit

Growth in half year ended Sep 2025 is -40.85% vs 58.55% in Sep 2024

Nine Monthly Results Snapshot (Consolidated) - Dec'25stock-summary

Dec'25
Dec'24
Change(%)
Net Sales
116.10
97.25
19.38%
Operating Profit (PBDIT) excl Other Income
21.59
10.95
97.17%
Interest
6.59
6.57
0.30%
Exceptional Items
0.00
0.00
Consolidate Net Profit
64.39
78.68
-18.16%
Operating Profit Margin (Excl OI)
18.60%
11.26%
7.34%
Values in Rs Cr.
Direction Arrows
Net Sales

YoY Growth in nine months ended Dec 2025 is 19.38% vs -9.93% in Dec 2024

Direction Arrows
Consolidated Net Profit

YoY Growth in nine months ended Dec 2025 is -18.16% vs 39.70% in Dec 2024

Annual Results Snapshot (Consolidated) - Mar'26stock-summary

Mar'26
Mar'25
Change(%)
Net Sales
213.13
151.85
40.36%
Operating Profit (PBDIT) excl Other Income
40.22
21.47
87.33%
Interest
8.43
8.42
0.12%
Exceptional Items
0.00
0.00
Consolidate Net Profit
68.38
91.71
-25.44%
Operating Profit Margin (Excl OI)
18.87%
14.14%
4.73%
Values in Rs Cr.
Direction Arrows
Net Sales

YoY Growth in year ended Mar 2026 is 40.36% vs 13.38% in Mar 2025

Direction Arrows
Consolidated Net Profit

YoY Growth in year ended Mar 2026 is -25.44% vs 46.99% in Mar 2025

stock-summaryCompany CV
About International Conveyors Ltd stock-summary
stock-summary
International Conveyors Ltd
Micro Cap
Industrial Manufacturing
International Conveyors Limited was incorporated in 1973 by Kolkata (INDIA) based entrepreneur Mr. R.K. Dabriwala. The Company is engaged in manufacturing of Polyvinyl Chloride (PVC) Conveyor Belt solutions for the mining sector and across all the industries. It manufactures solid-woven, fabric-reinforced, polyvinyl chloride (PVC)-impregnated and PVC-coated fire retardant anti-static conveyor belting. The Company operate into 3 segments: conveyor belting, wind energy and unallocated/corporate.
Company Coordinates stock-summary
Company Details
FaltaSEZ Sector2 Nr Pump House, No 3 Village & Mouza-Akalmegh Kolkata West Bengal : 743504
stock-summary
Tel:
stock-summary
icltd@iclbelting.com
Registrar Details
Maheshwari Datamatics Pvt Ltd , 6 Mangoe Lane , 2nd Floor, Calcutta