
Compare Inventurus Knowl with Similar Stocks
Dashboard
Strong Long Term Fundamental Strength with an average Return on Capital Employed (ROCE) of 30.80%
- Healthy long term growth as Net Sales has grown by an annual rate of 32.50% and Operating profit at 44.73%
- Strong ability to service debt as the company has a low Debt to EBITDA ratio of 1.00 times
With a growth in Net Profit of 13.81%, the company declared Very Positive results in Mar 26
Increasing Participation by Institutional Investors
Market Beating Performance
Stock DNA
Computers - Software & Consulting
INR 31,464 Cr (Small Cap)
43.00
32
0.00%
0.24
32.20%
13.90
Total Returns (Price + Dividend) 
Inventurus Knowl for the last several years.
Risk Adjusted Returns v/s
Returns Beta

News
Inventurus Knowledge Solutions Ltd is Rated Strong Buy
Inventurus Knowledge Solutions Ltd is rated Strong Buy by MarketsMOJO. This rating was last updated on 17 June 2026, reflecting a shift from the previous 'Buy' grade. However, all fundamentals, returns, and financial metrics discussed here are current as of 21 July 2026, providing investors with an up-to-date view of the stock's performance and prospects.
Read full news article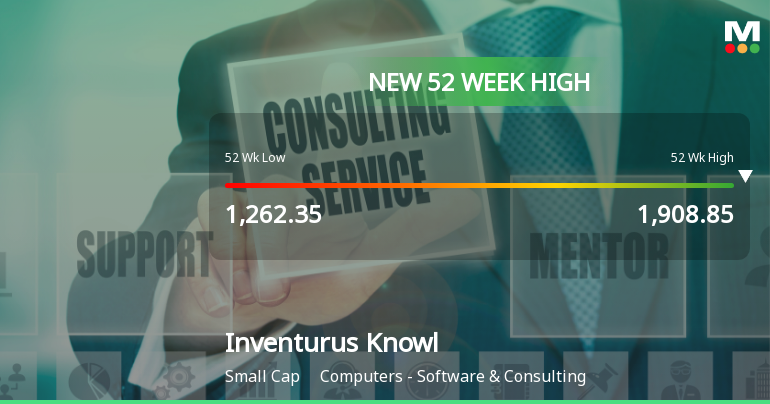
Broad-Based Technical Strength Lifts Inventurus Knowledge Solutions Ltd to 52-Week High of Rs 1915
With a decisive surge to Rs 1915 on 10 Jul 2026, Inventurus Knowledge Solutions Ltd has reached a fresh 52-week high, extending its upward momentum amid a backdrop of strong technical signals and outperforming the broader sector.
Read full news article
Inventurus Knowledge Solutions Ltd is Rated Strong Buy
Inventurus Knowledge Solutions Ltd is rated Strong Buy by MarketsMOJO, with this rating last updated on 17 June 2026. However, the analysis and financial metrics discussed here reflect the stock’s current position as of 10 July 2026, providing investors with the latest insights into the company’s performance and outlook.
Read full news article Announcements
Announcement under Regulation 30 (LODR)-Updates on Acquisition
14-Jul-2026 | Source : BSEEnclosed is intimation about update on additional investment in WWMG MSO LLC .
Compliances-Certificate under Reg. 74 (5) of SEBI (DP) Regulations 2018
10-Jul-2026 | Source : BSEAttached herewith is Certificate under Regulation 74(5) of SEBI (DP) Regulations 2018
Announcement under Regulation 30 (LODR)-Updates on Acquisition
10-Jul-2026 | Source : BSEEnclosed is intimation about update on acquisition.
Corporate Actions

No Upcoming Board Meetings

No Dividend history available

No Splits history available

No Bonus history available

No Rights history available
Quality key factors
Valuation key factors
Technicals key factors
 Technical Indicator Scale: Bearish, Mildly Bearish, Sideways, Mildly Bullish, Bullish Turned
 Shareholding Snapshot : Jun 2026
Shareholding Compare (%holding)
Promoters
None
Held by 22 Schemes (2.92%)
Held by 115 FIIs (8.0%)
Aryaman Jhunjhunwala Discretionary Trust (16.37%)
Government Pension Fund Global (2.97%)
9.98%
Quarterly Results Snapshot (Consolidated) - Mar'26 - QoQ

QoQ Growth in quarter ended Mar 2026 is 5.24% vs 4.33% in Dec 2025
QoQ Growth in quarter ended Mar 2026 is 12.35% vs 1.44% in Dec 2025
Half Yearly Results Snapshot (Standalone) - Sep'25
Not Applicable: The company has declared_date for only one period
Not Applicable: The company has declared_date for only one period
Nine Monthly Results Snapshot (Standalone) - Dec'25
Not Applicable: The company has declared_date for only one period
Not Applicable: The company has declared_date for only one period
Annual Results Snapshot (Consolidated) - Mar'26

YoY Growth in year ended Mar 2026 is 19.89% vs 46.54% in Mar 2025
YoY Growth in year ended Mar 2026 is 48.45% vs 31.19% in Mar 2025
About Inventurus Knowledge Solutions Ltd

Company Coordinates


