IOL Chemicals

  • Market Cap: Small Cap
  • Industry: Pharmaceuticals & Biotechnology
  • ISIN: INE485C01029
  • NSEID: IOLCP
  • BSEID: 524164
INR
202.91
-0.24 (-0.12%)
BSENSE

Sep 21, 03:59 PM

BSE+NSE Vol: 25.87 lacs

  • Price Points
  • Score
  • Mojo Parameters
  • Total Return
  • News and Corporate Actions
  • Key factors
  • Shareholding
  • Financials
  • CompanyCV
stock-summaryPrice Point
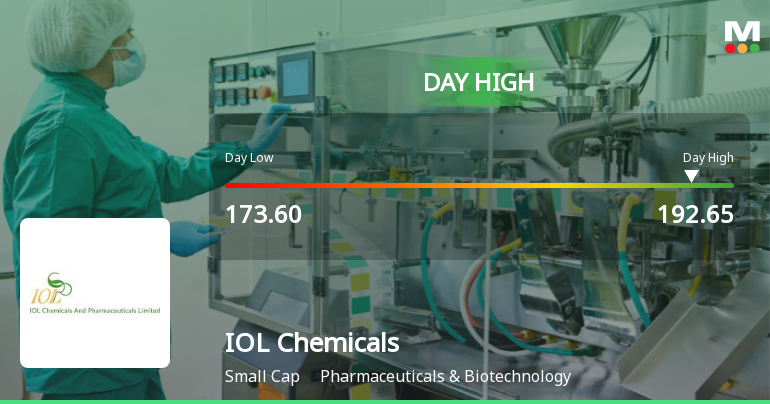
High/Low

1Day

52 Week

Valuation
Technical
Day's Volume

CASH

25.87 lacs (-55.68%) Volume

Shareholding (Jun 2026)

FII

4.87%

Held by 73 FIIs

DII

0.43%

Held by 2 DIIs

Promoter

62.28%

Why is IOL Chemicals & Pharmaceuticals Ltd falling/rising?

06-Sep-2026

As of 05-Sep, IOL Chemicals & Pharmaceuticals Ltd's stock price has risen to 200.05, reflecting a 2.07% increase, driven by strong financial performance, increased investor confidence, and a recent 52-week high of Rs. 205. The company has shown significant growth in net sales and profit, outperforming both its sector and the benchmark Sensex year-to-date.

As of 05-Sep, IOL Chemicals & Pharmaceuticals Ltd is experiencing a rise in its stock price, currently at 200.05, which reflects an increase of 4.05 or 2.07%. This upward movement can be attributed to several positive factors. Notably, the stock has recently hit a new 52-week high of Rs. 205 and has outperformed its sector by 1.8%. Over the last two days, the stock has gained 6.24%, indicating strong short-term momentum.<BR><BR>The company has demonstrated robust financial performance, with a significant growth in net sales of 22.09% and a profit before tax (PBT) growth of 80.3% compared to the previous four-quarter average. Additionally, the stock has consistently outperformed the benchmark Sensex, showing a remarkable 143.22% increase year-to-date, while the Sensex has declined by 10.21% in the same period.<BR><BR>Investor participation has also risen, with a notable increase in delivery volume by 46.5% against the five-day average, suggesting growing confidence among investors. Furthermore, the promoters have increased their stake in the company by 4.8%, indicating their strong belief in the company's future prospects.<BR><BR>Overall, the combination of strong financial results, increased investor confidence, and positive market performance contributes to the rising stock price of IOL Chemicals & Pharmaceuticals Ltd.

View full answer

Who are in the management team of IOL Chemicals?

01-Sep-2026

The management team of IOL Chemicals includes Varinder Gupta (Managing Director), Vikas Gupta (Joint Managing Director), Rajender Mohan Malla (Chairman), and several other directors and executives, all of whom guide the company's strategic direction and operations.

The management team of IOL Chemicals includes the following key members:<BR><BR>1. **Varinder Gupta** - Managing Director<BR>2. **Vikas Gupta** - Joint Managing Director<BR>3. **Rajender Mohan Malla** - Chairman & Independent Director<BR>4. **Sandhya Mehta** - Non-Executive & Independent Director<BR>5. **Harpal Singh** - Non-Executive & Independent Director<BR>6. **Kushal Kumar Rana** - Director (Works)<BR>7. **Abhay Raj Singh** - Company Secretary & Compliance Officer<BR>8. **Sharad Tyagi** - Independent Director<BR>9. **Abhiraj Gupta** - Executive Director<BR><BR>This team plays a crucial role in guiding the company's strategic direction and operations.

View full answer

What does IOL Chemicals do?

01-Sep-2026

IOL Chemicals and Pharmaceuticals Ltd specializes in Active Pharmaceutical Ingredients (APIs) and specialty chemicals, with a market cap of INR 5,627 Cr. As of June 2026, it reported net sales of 756 Cr and a net profit of 64 Cr.

Overview: <BR>IOL Chemicals and Pharmaceuticals Ltd is a prominent player in the Active Pharmaceutical Ingredient (API) and specialty chemicals sectors, operating within the Pharmaceuticals & Biotechnology industry and categorized as a Small Cap company.<BR><BR>History: <BR>Incorporated in September 1986, IOL Chemicals has established itself in the pharmaceutical sector. The latest quarterly results reported are for June 2026, showcasing the company's ongoing operations.<BR><BR>Financial Snapshot: <BR>Most recent Net Sales: 756 Cr (Quarterly Results - Jun 2026) <BR>Most recent Net Profit: 64 Cr (Quarterly Results - Jun 2026) <BR>Market-cap value: INR 5,627 Cr (Small Cap)<BR><BR>Key Metrics: <BR>P/E: 32.00 <BR>Industry P/E: 43 <BR>Dividend Yield: 0.52% <BR>Debt-Equity: -0.04 <BR>Return on Equity: 8.12% <BR>Price to Book: 3.17<BR><BR>Contact Details: <BR>Address: Trident Complex, Raikot Road Barnala Sangrur Punjab : 148101 <BR>Tel: 91-01679-244701-07 <BR>Email: contact@iolcp.com <BR>Website: http://www.iolcp.com

View full answer

Who are the peers of the IOL Chemicals?

01-Sep-2026

IOL Chemicals' peers include Senores Pharma, Bliss GVS Pharma, SPARC, Supriya Lifesci, Innova Captab, Orchid Pharma, Morepen Labs, FDC, and Guj. Themis Bio. Bliss GVS Pharma leads in 1-year returns at 295.64%, while IOL Chemicals has a return of 113.55%.

Peers: The peers of IOL Chemicals are Senores Pharma., Bliss GVS Pharma, SPARC, Supriya Lifesci., Innova Captab, Orchid Pharma, Morepen Labs., FDC, Guj. Themis Bio.<BR><BR>Quality Snapshot: Excellent management risk is observed at Innova Captab and Guj. Themis Bio., while Good management risk is found at Supriya Lifesci. and the rest have Average management risk. Growth is Excellent for Senores Pharma and SPARC, while Average growth is noted for Innova Captab and the rest have Below Average growth. Capital Structure is Excellent for Bliss GVS Pharma, Supriya Lifesci., Innova Captab, Morepen Labs., IOL Chemicals, FDC, and Guj. Themis Bio., while Good capital structure is seen at Supriya Lifesci. and Average capital structure is found at SPARC and the rest.<BR><BR>Return Snapshot: The peer with the highest 1-year return is Bliss GVS Pharma at 295.64%, while FDC has the lowest at -26.41%. IOL Chemicals has a 1-year return of 113.55%, which is significantly higher than FDC but lower than Bliss GVS Pharma. Additionally, FDC is the only peer with a negative six-month return.

View full answer

How big is IOL Chemicals?

01-Sep-2026

As of 31st August, IOL Chemicals & Pharmaceuticals Ltd has a market capitalization of 5,627.00 Cr, with recent net sales of 2,523.63 Cr and a net profit of 168.11 Cr. Shareholder's funds were 1,798.55 Cr, and total assets amounted to 2,586.95 Cr.

As of 31st August, IOL Chemicals & Pharmaceuticals Ltd has a market capitalization of 5,627.00 Cr, categorizing it as a Small Cap company.<BR><BR>In the latest 4 quarters, the company reported Net Sales of 2,523.63 Cr and a Net Profit of 168.11 Cr.<BR><BR>For the latest annual period ending in March 2026, the Shareholder's Funds were 1,798.55 Cr, and the Total Assets amounted to 2,586.95 Cr.

View full answer

Should I buy, sell or hold IOL Chemicals & Pharmaceuticals Ltd?

12-Aug-2026

When is the next results date for IOL Chemicals & Pharmaceuticals Ltd?

04-Aug-2026

The next results date for IOL Chemicals & Pharmaceuticals Ltd is 10 August 2026.

The next results date for IOL Chemicals & Pharmaceuticals Ltd is scheduled for 10 August 2026.

View full answer

Are IOL Chemicals & Pharmaceuticals Ltd latest results good or bad?

21-May-2026

IOL Chemicals & Pharmaceuticals Ltd reported strong Q4 FY26 results, with a net profit of ₹53.16 crores (up 69.19% year-on-year) and record revenue of ₹619.45 crores (up 17.37% year-on-year), indicating robust operational performance. However, the stock's current high valuation may limit upside potential for new investors.

IOL Chemicals & Pharmaceuticals Ltd has reported impressive results for Q4 FY26, indicating a strong performance. The company achieved a net profit of ₹53.16 crores, which reflects a remarkable 69.19% increase year-on-year and a staggering 158.31% growth compared to the previous quarter. This significant rise in profitability showcases the company's operational improvements and efficiency gains.<BR><BR>Revenue for the same quarter reached ₹619.45 crores, marking a 17.37% year-on-year increase and a 6.73% growth from the previous quarter. This is the highest quarterly revenue in the company's recent history, demonstrating robust demand across its pharmaceutical and specialty chemical segments.<BR><BR>Additionally, the operating margin improved to 14.93%, the highest in seven quarters, indicating effective cost management and enhanced productivity. The company also maintains a zero-debt balance sheet, which provides financial flexibility and stability.<BR><BR>Overall, these results suggest a positive trajectory for IOL Chemicals, showcasing both strong operational performance and financial health. However, the stock is currently trading at a valuation that some may consider "very expensive," which could limit upside potential for new investors. Existing shareholders may want to monitor the stock closely given the impressive quarterly results but should be cautious of the elevated valuations.

View full answer

Has IOL Chemicals & Pharmaceuticals Ltd declared dividend?

13-Feb-2026

Yes, IOL Chemicals & Pharmaceuticals Ltd has declared a 50% dividend, amounting to ₹4 per share, with an ex-date of February 18, 2025. Despite recent volatility, the company has shown positive total returns over the 1-year (8.15%) and 3-year (35.53%) periods.

IOL Chemicals & Pharmaceuticals Ltd has declared a dividend.<BR><BR>Dividend Details:<BR>- Percentage announced: 50%<BR>- Amount per share: 4<BR>- Ex-date: Feb-18-2025<BR><BR>Dividend Yield: 1.05%.<BR><BR>Total Returns by Period:<BR>In the last 3 months, the price return was -23.6%, the dividend return was 1.05%, resulting in a total return of -22.55%.<BR><BR>Over the past 6 months, the price return was -20.07%, the dividend return was 1.06%, leading to a total return of -19.01%.<BR><BR>In the 1-year period, the price return was 6.64%, the dividend return was 1.51%, culminating in a total return of 8.15%.<BR><BR>For the 2-year period, the price return was -6.18%, the dividend return was 6.07%, resulting in a total return of -0.11%.<BR><BR>In the last 3 years, the price return was 18.32%, the dividend return was 17.21%, which led to a total return of 35.53%.<BR><BR>Over the 4-year period, the price return was -7.45%, the dividend return was 21.63%, resulting in a total return of 14.18%.<BR><BR>In the 5-year span, the price return was -44.32%, the dividend return was 16.35%, leading to a total return of -27.97%.<BR><BR>Overall, IOL Chemicals & Pharmaceuticals Ltd has declared a substantial dividend, and while the recent total returns have shown volatility, the company has managed to provide positive returns over longer periods, particularly in the 1-year and 3-year spans.

View full answer

How has been the historical performance of IOL Chemicals?

12-Nov-2025

IOL Chemicals has experienced a declining trend in net sales and profits over the past few years, with net sales dropping from 2,217.11 Cr in March 2023 to 2,079.21 Cr in March 2025, and profit after tax decreasing from 134.43 Cr to 101.07 Cr in the same period. Despite this, total assets increased to 2,382.07 Cr in March 2025.

Answer:<BR>The historical performance of IOL Chemicals shows a declining trend in net sales and profits over the past few years.<BR><BR>Breakdown:<BR>IOL Chemicals reported net sales of 2,079.21 Cr in March 2025, down from 2,132.79 Cr in March 2024 and 2,217.11 Cr in March 2023, indicating a consistent decrease in revenue. Total operating income mirrored this decline, with figures of 2,079.21 Cr in March 2025 compared to 2,132.79 Cr in the previous year. The total expenditure, excluding depreciation, also decreased to 1,876.91 Cr in March 2025 from 1,902.20 Cr in March 2024. Operating profit (PBDIT) fell to 224.71 Cr in March 2025, down from 260.66 Cr in March 2024, while profit before tax decreased to 137.96 Cr from 181.65 Cr. Consequently, profit after tax was 101.07 Cr in March 2025, a decline from 134.43 Cr in March 2024. The company's total assets increased to 2,382.07 Cr in March 2025 from 2,244.40 Cr in March 2024, while total liabilities also rose to 2,382.07 Cr from 2,244.40 Cr. Cash flow from operating activities was 178.00 Cr in March 2025, down from 289.00 Cr in March 2024, but net cash inflow improved to 70.00 Cr from 6.00 Cr. Overall, the financial metrics reflect a challenging period for IOL Chemicals, characterized by declining sales and profits despite an increase in total assets.

View full answer

Is IOL Chemicals technically bullish or bearish?

10-Oct-2025

As of October 9, 2025, IOL Chemicals exhibits a mildly bullish trend supported by MACD and Bollinger Bands, though tempered by a mildly bearish KST and Dow Theory signals on the weekly chart.

As of 9 October 2025, the technical trend for IOL Chemicals has changed from bullish to mildly bullish. The current stance is mildly bullish, supported by weekly and monthly MACD indicators both showing bullish signals. The Bollinger Bands also reflect a mildly bullish trend in both time frames. However, the KST indicates a mildly bearish stance on the weekly chart, and Dow Theory shows a mildly bearish trend on the weekly level with no trend on the monthly. The daily moving averages are mildly bullish, but the overall strength is tempered by the recent price action, including a decline from the previous close.

View full answer

Who are the top shareholders of the IOL Chemicals?

17-Jul-2025

The top shareholders of IOL Chemicals include Maya Devi Polycot Limited with 21.54%, Vasudeva Commercials Limited at 7.94%, and individual investors holding 31.43%. Mutual funds hold 0.02%, while Foreign Institutional Investors (FIIs) account for 1.47%.

The top shareholders of IOL Chemicals include the promoters, who hold a significant majority. The promoter with the highest holding is Maya Devi Polycot Limited, which owns 21.54% of the shares. Additionally, the highest public shareholder is Vasudeva Commercials Limited, holding 7.94%. Individual investors collectively hold 31.43% of the shares, while mutual funds have a minor stake through six schemes, accounting for 0.02%. Foreign Institutional Investors (FIIs) hold 1.47% of the company through 47 different entities.

View full answer

Is IOL Chemicals overvalued or undervalued?

09-Jun-2025

As of May 19, 2025, IOL Chemicals is considered very expensive and overvalued compared to its peers, with key financial ratios significantly higher and lower returns, making it an unfavorable investment despite a recent strong performance.

As of 19 May 2025, the valuation grade for IOL Chemicals has moved from fair to very expensive. The company is currently overvalued based on its financial metrics. Key ratios include a PE ratio of 25.73, an EV to EBITDA of 12.39, and a Price to Book Value of 1.54, which are significantly higher than many of its peers.<BR><BR>In comparison, Solar Industries has a PE ratio of 123.77 and an EV to EBITDA of 76.22, while Godrej Industries, which is rated attractive, has a PE ratio of 46.63 and an EV to EBITDA of 34.36. These comparisons highlight that IOL Chemicals is not only overvalued relative to its peers but also lacks competitive returns, with a ROE of 5.99% and a ROCE of 8.18%. Despite a strong 1-month return of 42.94% compared to the Sensex's 3.88%, the overall valuation indicates that IOL Chemicals is not a favorable investment at this time.

View full answer
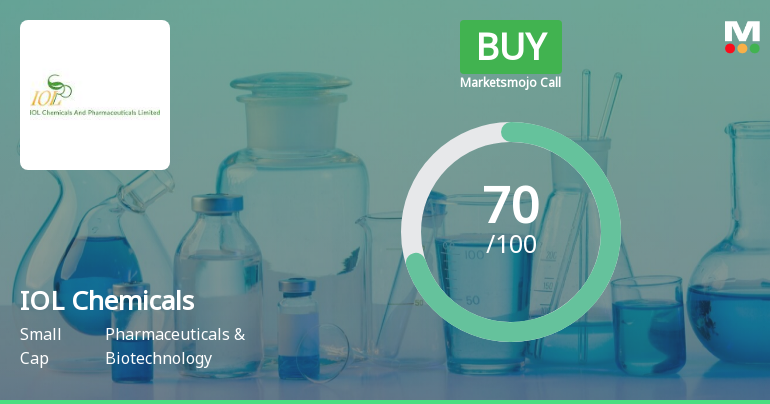
iScoreScore
Part of MojoOne Strategy
Click here to find our call on this stock
Strong Sell
Sell
Hold
Buy
Strong Buy

Dashboard

1

Company has a Debt to Equity ratio (avg) of 0.01 times

 
2

With a growth in Net Sales of 22.09%, the company declared Very Positive results in Jun 26

3

Rising Promoter Confidence

4

Market Beating performance in long term as well as near term

stock-summaryMojo Parameters

Mojo Parameters

Loading Valuation Snapshot...

Stock DNA

stock-summary
Industry

Pharmaceuticals & Biotechnology

stock-summary
Market cap

INR 6,080 Cr (Small Cap)

stock-summary
P/E

34.00

stock-summary
Industry P/E

27

stock-summary
Dividend Yield

0.49%

stock-summary
Debt Equity

-0.04

stock-summary
Return on Equity

8.12%

stock-summary
Price to Book

3.31

Revenue and Profits:
Net Sales:
756 Cr
(Quarterly Results - Jun 2026)
Net Profit:
64 Cr
stock-summaryTotal Returns
Total Returns (Price + Dividend) stock-summary
Dividend Yield (0.49%)
TimePeriod
Price Return
Dividend Return
Total Return
3 Months
55.83%
0%
55.83%
6 Months
172.88%
0%
172.88%
1 Year
69.19%
0.96%
70.15%
2 Years
108.56%
1.89%
110.45%
3 Years
112.12%
3.08%
115.2%
4 Years
178.8%
4.91%
183.71%
5 Years
78.19%
3.62%
81.81%

Latest dividend: 1 per share ex-dividend date: Feb-17-2026

Risk Adjusted Returns v/s stock-summary
Returns Beta
Icon
Beta has not been calculated since enough price history is not available
stock-summaryNews & Corporate Actions

News

IOL Chemicals & Pharmaceuticals Ltd Gains 4.88%: Key Factors Behind the Weekly Rebound

Announcements stock-summary

IOL Chemicals and Pharmaceuticals Limited - Updates

27-Nov-2019 | Source : NSE

IOL Chemicals and Pharmaceuticals Limited has informed the Exchange regarding 'Copy of Notice published in newspapers regarding loss of Share Certificates'.

IOL Chemicals and Pharmaceuticals Limited - Updates

18-Nov-2019 | Source : NSE

IOL Chemicals and Pharmaceuticals Limited has informed the Exchange regarding 'Submission of newspaper cutting of audited financial results for the quarter and half year ended 30 September 2019'.

IOL Chemicals and Pharmaceuticals Limited - Change in Company Secretary / Compliance Officer

15-Nov-2019 | Source : NSE

IOL Chemicals and Pharmaceuticals Limited has informed the Exchange about The Board of Directors in its meeting held on 14.11.2019 has approved the appointment of Mr Abhay Raj Singh as Company Secretary and Compliance Officer of the Company in place of Mr Krishan Singla, Vice President & Company Secretary, who is getting superannuated on 14 November 2019

Corporate Actions stock-summary

stock-summary
BOARD MEETING

No Upcoming Board Meetings

stock-summary
DIVIDEND

IOL Chemicals & Pharmaceuticals Ltd has declared 50% dividend, ex-date: 17 Feb 26

stock-summary
SPLITS

IOL Chemicals & Pharmaceuticals Ltd has announced 2:10 stock split, ex-date: 11 Mar 25

stock-summary
BONUS

No Bonus history available

stock-summary
RIGHTS

No Rights history available

stock-summaryKey Factors

Quality key factors stock-summary

Factor
Value
Sales Growth (5y)
4.44%
EBIT Growth (5y)
5.83%
EBIT to Interest (avg)
11.49
Debt to EBITDA (avg)
0.52
Net Debt to Equity (avg)
-0.04
Sales to Capital Employed (avg)
1.13
Tax Ratio
25.46%
Dividend Payout Ratio
23.24%
Pledged Shares
0
Institutional Holding
5.31%
ROCE (avg)
9.29%
ROE (avg)
7.92%

Valuation key factors

Factor
Value
P/E Ratio
34
Industry P/E
27
Price to Book Value
3.31
EV to EBIT
25.78
EV to EBITDA
18.98
EV to Capital Employed
3.40
EV to Sales
2.33
PEG Ratio
0.50
Dividend Yield
0.49%
ROCE (Latest)
10.90%
ROE (Latest)
8.12%

Technicals key factors

Indicator
Weekly
Monthly
MACD
Bullish
Bullish
RSI
No Signal
Bearish
Bollinger Bands
Bullish
Bullish
Moving Averages
Bullish (Daily)
KST
Mildly Bearish
Bullish
Dow Theory
Bullish
Bullish
OBV
Bullish
Bullish
stock-summary Technical Indicator Scale: Bearish, Mildly Bearish, Sideways, Mildly Bullish, Bullish  Turned 
stock-summaryShareholding
Shareholding Snapshot : Jun 2026stock-summary
Shareholding Compare (%holding) stock-summary
Majority shareholders

Promoters

Pledged Promoter Holdings

None

Mutual Funds

Held by 6 Schemes (0.02%)

FIIs

Held by 73 FIIs (4.87%)

Promoter with highest holding

Nm Merchantiles Limited (21.88%)

Highest Public shareholder

None

Individual Investors Holdings

26.95%

stock-summaryFinancial
[
  {
    "link": "quarterly",
    "btn_text": "All Quarterly Results",
    "header": "Quarterly Results Snapshot (Consolidated) - Jun'26 - QoQ",
    "rhs": [
      {
        "prefix": "Net Sales ",
        "suffix": "QoQ Growth in quarter ended Jun 2026 is 22.09% vs 6.73% in Mar 2026",
        "dir": 1
      },
      {
        "prefix": "Consolidated Net Profit ",
        "suffix": "QoQ Growth in quarter ended Jun 2026 is 21.14% vs 158.31% in Mar 2026",
        "dir": -1
      }
    ],
    "table": {
      "header": [
        "Jun'26",
        "Mar'26",
        "Change(%)"
      ],
      "body": [
        {
          "field": "Net Sales",
          "val1": "756.26",
          "val2": "619.45",
          "chgp": "22.09%",
          "chgp_class": "positive"
        },
        {
          "field": "Operating Profit (PBDIT) excl Other Income",
          "val1": "103.49",
          "val2": "92.47",
          "chgp": "11.92%",
          "chgp_class": "positive"
        },
        {
          "field": "Interest",
          "val1": "3.64",
          "val2": "3.21",
          "chgp": "13.40%",
          "chgp_class": "negative"
        },
        {
          "field": "Exceptional Items",
          "val1": "0.00",
          "val2": "0.00",
          "chgp": "",
          "chgp_class": "neutral"
        },
        {
          "field": "Consolidate Net Profit",
          "val1": "64.40",
          "val2": "53.16",
          "chgp": "21.14%",
          "chgp_class": "positive"
        },
        {
          "field": "Operating Profit Margin (Excl OI)",
          "val1": "13.68%",
          "val2": "14.93%",
          "chgp": "-1.25%",
          "chgp_class": "negative"
        }
      ]
    }
  },
  {
    "link": "half-yearly",
    "btn_text": "All Half Yearly Results",
    "header": "Half Yearly Results Snapshot (Consolidated) - Sep'25",
    "rhs": [
      {
        "prefix": "Net Sales ",
        "suffix": " Growth in half year ended Sep 2025 is 8.86% vs -7.25% in Sep 2024",
        "dir": 1
      },
      {
        "prefix": "Consolidated Net Profit ",
        "suffix": " Growth in half year ended Sep 2025 is 30.09% vs -41.34% in Sep 2024",
        "dir": 1
      }
    ],
    "table": {
      "header": [
        "Sep'25",
        "Sep'24",
        "Change(%)"
      ],
      "body": [
        {
          "field": "Net Sales",
          "val1": "1,119.22",
          "val2": "1,028.13",
          "chgp": "8.86%",
          "chgp_class": "positive"
        },
        {
          "field": "Operating Profit (PBDIT) excl Other Income",
          "val1": "119.22",
          "val2": "92.68",
          "chgp": "28.64%",
          "chgp_class": "positive"
        },
        {
          "field": "Interest",
          "val1": "7.71",
          "val2": "6.27",
          "chgp": "22.97%",
          "chgp_class": "negative"
        },
        {
          "field": "Exceptional Items",
          "val1": "0.00",
          "val2": "0.00",
          "chgp": "",
          "chgp_class": "neutral"
        },
        {
          "field": "Consolidate Net Profit",
          "val1": "63.90",
          "val2": "49.12",
          "chgp": "30.09%",
          "chgp_class": "positive"
        },
        {
          "field": "Operating Profit Margin (Excl OI)",
          "val1": "10.65%",
          "val2": "9.01%",
          "chgp": "1.64%",
          "chgp_class": "positive"
        }
      ]
    }
  },
  {
    "link": "nine-monthly",
    "btn_text": "All Nine Monthly Results",
    "header": "Nine Monthly Results Snapshot (Consolidated) - Dec'25",
    "rhs": [
      {
        "prefix": "Net Sales ",
        "suffix": "YoY Growth in nine months ended Dec 2025 is 9.55% vs -4.75% in Dec 2024",
        "dir": 1
      },
      {
        "prefix": "Consolidated Net Profit ",
        "suffix": "YoY Growth in nine months ended Dec 2025 is 21.29% vs -34.79% in Dec 2024",
        "dir": 1
      }
    ],
    "table": {
      "header": [
        "Dec'25",
        "Dec'24",
        "Change(%)"
      ],
      "body": [
        {
          "field": "Net Sales",
          "val1": "1,699.61",
          "val2": "1,551.43",
          "chgp": "9.55%",
          "chgp_class": "positive"
        },
        {
          "field": "Operating Profit (PBDIT) excl Other Income",
          "val1": "176.50",
          "val2": "139.55",
          "chgp": "26.48%",
          "chgp_class": "positive"
        },
        {
          "field": "Interest",
          "val1": "11.34",
          "val2": "10.73",
          "chgp": "5.68%",
          "chgp_class": "negative"
        },
        {
          "field": "Exceptional Items",
          "val1": "-11.21",
          "val2": "0.00",
          "chgp": "",
          "chgp_class": "neutral"
        },
        {
          "field": "Consolidate Net Profit",
          "val1": "84.48",
          "val2": "69.65",
          "chgp": "21.29%",
          "chgp_class": "positive"
        },
        {
          "field": "Operating Profit Margin (Excl OI)",
          "val1": "10.38%",
          "val2": "8.99%",
          "chgp": "1.39%",
          "chgp_class": "positive"
        }
      ]
    }
  },
  {
    "link": "annual",
    "btn_text": "All Annual Results",
    "header": "Annual Results Snapshot (Consolidated) - Mar'26",
    "rhs": [
      {
        "prefix": "Net Sales ",
        "suffix": "YoY Growth in year ended Mar 2026 is 11.54% vs -2.51% in Mar 2025",
        "dir": 1
      },
      {
        "prefix": "Consolidated Net Profit ",
        "suffix": "YoY Growth in year ended Mar 2026 is 36.18% vs -24.82% in Mar 2025",
        "dir": 1
      }
    ],
    "table": {
      "header": [
        "Mar'26",
        "Mar'25",
        "Change(%)"
      ],
      "body": [
        {
          "field": "Net Sales",
          "val1": "2,319.06",
          "val2": "2,079.21",
          "chgp": "11.54%",
          "chgp_class": "positive"
        },
        {
          "field": "Operating Profit (PBDIT) excl Other Income",
          "val1": "268.97",
          "val2": "202.30",
          "chgp": "32.96%",
          "chgp_class": "positive"
        },
        {
          "field": "Interest",
          "val1": "14.55",
          "val2": "14.76",
          "chgp": "-1.42%",
          "chgp_class": "positive"
        },
        {
          "field": "Exceptional Items",
          "val1": "-11.21",
          "val2": "0.00",
          "chgp": "",
          "chgp_class": "neutral"
        },
        {
          "field": "Consolidate Net Profit",
          "val1": "137.64",
          "val2": "101.07",
          "chgp": "36.18%",
          "chgp_class": "positive"
        },
        {
          "field": "Operating Profit Margin (Excl OI)",
          "val1": "11.60%",
          "val2": "9.73%",
          "chgp": "1.87%",
          "chgp_class": "positive"
        }
      ]
    }
  }
]

Quarterly Results Snapshot (Consolidated) - Jun'26 - QoQstock-summary

Jun'26
Mar'26
Change(%)
Net Sales
756.26
619.45
22.09%
Operating Profit (PBDIT) excl Other Income
103.49
92.47
11.92%
Interest
3.64
3.21
13.40%
Exceptional Items
0.00
0.00
Consolidate Net Profit
64.40
53.16
21.14%
Operating Profit Margin (Excl OI)
13.68%
14.93%
-1.25%
Values in Rs Cr.
Direction Arrows
Net Sales

QoQ Growth in quarter ended Jun 2026 is 22.09% vs 6.73% in Mar 2026

Direction Arrows
Consolidated Net Profit

QoQ Growth in quarter ended Jun 2026 is 21.14% vs 158.31% in Mar 2026

Half Yearly Results Snapshot (Consolidated) - Sep'25stock-summary

Sep'25
Sep'24
Change(%)
Net Sales
1,119.22
1,028.13
8.86%
Operating Profit (PBDIT) excl Other Income
119.22
92.68
28.64%
Interest
7.71
6.27
22.97%
Exceptional Items
0.00
0.00
Consolidate Net Profit
63.90
49.12
30.09%
Operating Profit Margin (Excl OI)
10.65%
9.01%
1.64%
Values in Rs Cr.
Direction Arrows
Net Sales

Growth in half year ended Sep 2025 is 8.86% vs -7.25% in Sep 2024

Direction Arrows
Consolidated Net Profit

Growth in half year ended Sep 2025 is 30.09% vs -41.34% in Sep 2024

Nine Monthly Results Snapshot (Consolidated) - Dec'25stock-summary

Dec'25
Dec'24
Change(%)
Net Sales
1,699.61
1,551.43
9.55%
Operating Profit (PBDIT) excl Other Income
176.50
139.55
26.48%
Interest
11.34
10.73
5.68%
Exceptional Items
-11.21
0.00
Consolidate Net Profit
84.48
69.65
21.29%
Operating Profit Margin (Excl OI)
10.38%
8.99%
1.39%
Values in Rs Cr.
Direction Arrows
Net Sales

YoY Growth in nine months ended Dec 2025 is 9.55% vs -4.75% in Dec 2024

Direction Arrows
Consolidated Net Profit

YoY Growth in nine months ended Dec 2025 is 21.29% vs -34.79% in Dec 2024

Annual Results Snapshot (Consolidated) - Mar'26stock-summary

Mar'26
Mar'25
Change(%)
Net Sales
2,319.06
2,079.21
11.54%
Operating Profit (PBDIT) excl Other Income
268.97
202.30
32.96%
Interest
14.55
14.76
-1.42%
Exceptional Items
-11.21
0.00
Consolidate Net Profit
137.64
101.07
36.18%
Operating Profit Margin (Excl OI)
11.60%
9.73%
1.87%
Values in Rs Cr.
Direction Arrows
Net Sales

YoY Growth in year ended Mar 2026 is 11.54% vs -2.51% in Mar 2025

Direction Arrows
Consolidated Net Profit

YoY Growth in year ended Mar 2026 is 36.18% vs -24.82% in Mar 2025

stock-summaryCompany CV
About IOL Chemicals & Pharmaceuticals Ltd stock-summary
stock-summary
IOL Chemicals & Pharmaceuticals Ltd
Small Cap
Pharmaceuticals & Biotechnology
IOL Chemicals and Pharmaceuticals Limited, incorporated in September, 1986 is a renowned company in the Active Pharmaceutical Ingredient (API) and specialty chemicals sectors. Its extensive expertise in both API and specialty chemicals strengthens the business model and opens doors to diversified growth opportunities. Within the API segment, IOL develops and supplies a wide range of essential products utilized by pharmaceutical companies worldwide for the production of key medicines.
Company Coordinates stock-summary
Company Details
Trident Complex, Raikot Road Barnala Sangrur Punjab : 148101
stock-summary
Tel: 91-01679-244701-07
stock-summary
contact@iolcp.com
Registrar Details
Alankit Assignments Ltd , Alankit House , 2 E/21, Jhandewala Extension, New Delhi