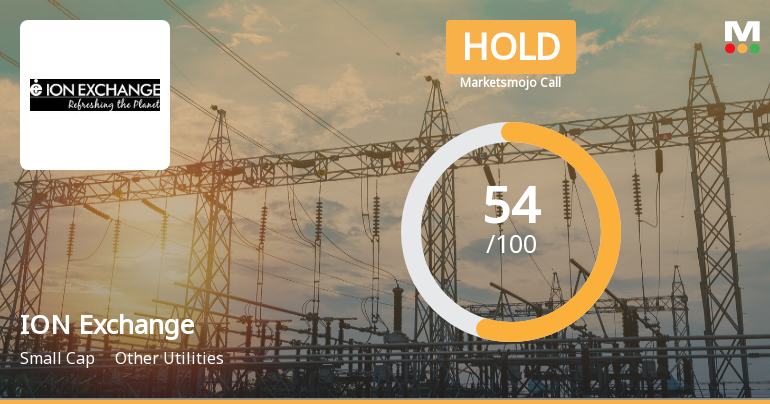
ION Exchange

  • Market Cap: Small Cap
  • Industry: Other Utilities
  • ISIN: INE570A01022
  • NSEID: IONEXCHANG
  • BSEID: 500214
INR
440.90
-4.8 (-1.08%)
BSENSE

Sep 15, 11:36 AM

BSE+NSE Vol: 2.61 lacs

  • Price Points
  • Score
  • Mojo Parameters
  • Total Return
  • News and Corporate Actions
  • Key factors
  • Shareholding
  • Financials
  • CompanyCV
stock-summaryPrice Point
High/Low

1Day

52 Week

Valuation
Technical
Day's Volume

CASH

2.61 lacs (-70.57%) Volume

Shareholding (Jun 2026)

FII

4.86%

Held by 97 FIIs

DII

15.32%

Held by 15 DIIs

Promoter

25.43%

Why is Ion Exchange (India) Ltd falling/rising?

06-Sep-2026

As of 05-Sep, Ion Exchange (India) Ltd's stock price has risen to 409.45, reflecting a 7.0% increase due to strong buying interest and improved trading activity. Despite recent positive trends, the company has faced long-term challenges, including negative results in the last three quarters.

As of 05-Sep, Ion Exchange (India) Ltd is experiencing a rise in its stock price, currently at 409.45, reflecting a change of 26.8 or 7.0% increase. This upward movement can be attributed to several factors. Firstly, the stock has outperformed its sector by 7.53% today and has shown a consecutive gain over the last four days, accumulating a total return of 12.49% during this period. Additionally, the stock reached an intraday high of Rs 412, indicating strong buying interest.<BR><BR>The trading activity also suggests increased investor participation, with delivery volume rising by 96.84% compared to the five-day average, which indicates heightened interest from investors. Furthermore, Ion Exchange is trading above its moving averages across various time frames, including the 5-day, 20-day, 50-day, 100-day, and 200-day moving averages, which typically signals a bullish trend.<BR><BR>Moreover, the company benefits from high management efficiency, as evidenced by a return on equity (ROE) of 19.29%, and a low debt-to-equity ratio of 0.02, suggesting a strong financial position. Institutional holdings are also significant at 20.18%, with an increase of 0.76% in their stake over the previous quarter, indicating confidence from larger investors.<BR><BR>However, it is important to note that despite the recent positive price movement, the company has faced challenges in the long term, including negative results for the last three consecutive quarters and poor growth in operating profit over the past five years. Nonetheless, the current rise in stock price appears to be driven by short-term positive performance indicators and increased investor interest.

View full answer

Who are in the management team of ION Exchange?

01-Sep-2026

The management team of ION Exchange includes key members such as Rajesh Sharma (Chairman), Dinesh Sharma, Aankur Patni (Executive Directors), and several Independent Non-Executive Directors like V N Gupchup and T M M Nambiar, among others, who guide the company's strategic direction.

The management team of ION Exchange includes the following key members:<BR><BR>1. **Rajesh Sharma** - Chairman / Executive Director<BR>2. **Dinesh Sharma** - Executive Director<BR>3. **Aankur Patni** - Executive Director<BR>4. **V N Gupchup** - Independent Non-Executive Director<BR>5. **M P Patni** - Non-Executive Director<BR>6. **T M M Nambiar** - Independent Non-Executive Director<BR>7. **P Sampathkumar** - Independent Non-Executive Director<BR>8. **Abhiram Seth** - Independent Non-Executive Director<BR>9. **Shishir Tamotia** - Independent Non-Executive Director<BR>10. **K J Udeshi** - Independent Non-Executive Director<BR>11. **David Rasquinha** - Independent Non-Executive Director<BR>12. **Sanjay Vithalrao Joshi** - Independent Non-Executive Director<BR>13. **Milind Puranik** - Company Secretary<BR>14. **Rohit Ghanshyamdas Totla** - Whole-Time Director & Additional Director<BR><BR>This team plays a crucial role in guiding the company's strategic direction and operations.

View full answer

What does ION Exchange do?

01-Sep-2026

Ion Exchange (India) Ltd specializes in water treatment solutions for various sectors and is a small-cap company with a market cap of INR 5,376 Cr. As of June 2026, it reported net sales of 700 Cr and a net profit of 4 Cr.

Overview:<BR>Ion Exchange (India) Ltd is a leader in the Indian water treatment industry, offering total water management solutions for industries, homes, and communities, and operates within the small-cap market segment.<BR><BR>History:<BR>Established on March 6, 1964, Ion Exchange became a wholly Indian company after British Permutit divested its holdings in 1985. The latest quarterly results reported net sales and net profit for June 2026.<BR><BR>Financial Snapshot:<BR>- Net Sales: 700 Cr (Quarterly Results - Jun 2026)<BR>- Net Profit: 4 Cr (Quarterly Results - Jun 2026)<BR>- Market Cap: INR 5,376 Cr (Small Cap)<BR><BR>Key Metrics:<BR>- P/E: 48.00<BR>- Industry P/E: 41<BR>- Dividend Yield: 0.00%<BR>- Debt-Equity: 0.12<BR>- Return on Equity: 11.56%<BR>- Price to Book: 4.06<BR><BR>Contact Details:<BR>Address: Ion House P O Box 6273, Dr E Moses Road Mahalaxmi Mumbai Maharashtra : 400011<BR>Tel: 91-22-39890909<BR>Email: ieil@ionexchange.co.in<BR>Website: http://www.ionindia.com

View full answer

Who are the peers of the ION Exchange?

01-Sep-2026

Peers of ION Exchange include Va Tech Wabag, Inox Green, Enviro Infra, EMS, Rajesh Power, Antony Waste, Eco Recyc., JITF Infra Logis, and Denta Water. Va Tech Wabag shows the highest 1-year return at 35.64%, while Rajesh Power has the lowest at -48.33%, with ION Exchange at -12.78%.

Peers: The peers of ION Exchange are Va Tech Wabag, Inox Green, Enviro Infra, EMS, Rajesh Power, Antony Waste han, Eco Recyc., JITF Infra Logis, and Denta Water.<BR><BR>Quality Snapshot: Excellent management risk is observed at Va Tech Wabag and ION Exchange, while Average management risk is found at Enviro Infra, EMS, Rajesh Power, Antony Waste han, Eco Recyc., and Denta Water, and the rest. Below Average management risk is noted for Inox Green. Growth is Excellent at Rajesh Power and Eco Recyc., while Good growth is seen at Inox Green, and the rest exhibit Below Average growth. Capital Structure is Excellent at ION Exchange, Enviro Infra, EMS, and Eco Recyc., while Good capital structure is found at Va Tech Wabag and Rajesh Power, and the rest have Average or do not qualify.<BR><BR>Return Snapshot: The peer with the highest 1-year return is Va Tech Wabag at 35.64%, while Rajesh Power has the lowest at -48.33%, with ION Exchange's own return at -12.78% being significantly lower than Va Tech Wabag's. Additionally, EMS, Rajesh Power, Antony Waste han, Eco Recyc., and Denta Water all have negative six-month returns.

View full answer

How big is ION Exchange?

01-Sep-2026

As of 31st August, Ion Exchange (India) Ltd has a market capitalization of 5,376.00 Cr, with recent Net Sales of 3,032.11 Cr and a Net Profit of 98.08 Cr. Shareholder's Funds are 1,339.03 Cr and Total Assets are 3,365.54 Cr.

As of 31st August, Ion Exchange (India) Ltd has a market capitalization of 5,376.00 Cr, categorizing it as a Small Cap company.<BR><BR>In the latest four quarters, the company reported Net Sales of 3,032.11 Cr and a Net Profit of 98.08 Cr.<BR><BR>For the latest annual period ending in March 2026, the Shareholder's Funds amounted to 1,339.03 Cr, while the Total Assets were valued at 3,365.54 Cr.

View full answer

Should I buy, sell or hold Ion Exchange (India) Ltd?

07-Aug-2026

When is the next results date for Ion Exchange (India) Ltd?

30-Jul-2026

The next results date for Ion Exchange (India) Ltd is August 5, 2026.

The next results date for Ion Exchange (India) Ltd is scheduled for August 5, 2026.

View full answer

Are Ion Exchange (India) Ltd latest results good or bad?

28-May-2026

Ion Exchange (India) Ltd's latest Q4 FY26 results show record revenue growth of 3.44% year-on-year, but a significant 61.89% decline in net profit and the lowest operating margin in eight quarters indicate serious operational challenges, making the overall performance more negative than positive. Investors should be cautious until signs of recovery emerge.

Ion Exchange (India) Ltd's latest results for Q4 FY26 reflect a challenging performance overall. While the company achieved a record revenue of ₹863.27 crores, marking a 3.44% increase year-on-year and a 17.54% increase quarter-on-quarter, this growth is overshadowed by significant declines in profitability.<BR><BR>The net profit for the quarter was ₹24.14 crores, which represents a staggering 61.89% decrease compared to the same quarter last year. This decline indicates severe pressure on the company's bottom line despite the revenue growth. Additionally, the operating margin, excluding other income, fell to 2.30%, the lowest in eight quarters, down from 10.29% in Q4 FY25. This 800 basis point drop highlights significant operational challenges.<BR><BR>The company's reliance on non-operating income is also concerning, as it constituted 132.87% of profit before tax, suggesting that core operations are struggling to generate adequate returns. Furthermore, rising employee costs and interest expenses have compounded the financial strain, leading to a negative cash flow from operations.<BR><BR>In summary, while Ion Exchange has shown revenue growth, the substantial decline in net profit and operating margins indicates serious underlying issues, making the latest results more negative than positive. Investors should approach the company with caution until there are clear signs of operational recovery.

View full answer

Is ION Exchange overvalued or undervalued?

03-Dec-2025

As of December 2, 2025, ION Exchange is considered very attractive and undervalued, with a PE Ratio of 23.73, an EV to EBITDA of 17.16, and a ROCE of 18.51%, significantly lower than peers like Thermax and BEML Ltd, despite a year-to-date return of -48.09% compared to the Sensex's 8.96%, but with a promising long-term outlook reflected in a 5-year return of 315.77%.

As of 2 December 2025, the valuation grade for ION Exchange has moved from attractive to very attractive, indicating a significant positive shift in its perceived value. The company is currently assessed as undervalued. Key ratios include a PE Ratio of 23.73, an EV to EBITDA of 17.16, and a ROCE of 18.51%. <BR><BR>In comparison to its peers, ION Exchange's PE Ratio is substantially lower than Thermax's 58.7 and BEML Ltd's 50.43, both of which are categorized as expensive. Additionally, the PEG Ratio for ION Exchange stands at 0.00, suggesting that the stock may be undervalued relative to its growth potential. Despite recent underperformance against the Sensex, with a year-to-date return of -48.09% compared to the Sensex's 8.96%, the long-term outlook remains promising, as evidenced by a 5-year return of 315.77%.

View full answer

How has been the historical performance of ION Exchange?

06-Nov-2025

ION Exchange has shown consistent growth in net sales and profits from March 2019 to March 2025, with net sales increasing from 1,162.28 Cr to 2,737.11 Cr and profit after tax rising from 65.34 Cr to 207.25 Cr. The company's total assets and liabilities also grew significantly during this period, indicating robust financial health.

Answer:<BR>The historical performance of ION Exchange shows a consistent growth trajectory in net sales and profit over the years, culminating in the fiscal year ending March 2025.<BR><BR>Breakdown:<BR>ION Exchange's net sales have steadily increased from 1,162.28 Cr in March 2019 to 2,737.11 Cr in March 2025, reflecting a strong upward trend. Total operating income followed suit, rising from 1,576.87 Cr in March 2022 to 2,737.11 Cr in March 2025. The company's operating profit (PBDIT) also demonstrated growth, reaching 342.43 Cr in March 2025, up from 139.90 Cr in March 2019. Profit before tax increased from 101.27 Cr in March 2019 to 284.48 Cr in March 2025, while profit after tax rose from 65.34 Cr to 207.25 Cr over the same period. The total assets of the company grew significantly from 1,380.79 Cr in March 2020 to 2,979.24 Cr in March 2025, indicating robust asset accumulation. Total liabilities also increased, from 1,380.79 Cr in March 2020 to 2,979.24 Cr in March 2025, driven by higher long-term borrowings. Cash flow from operating activities, however, showed fluctuations, peaking at 197 Cr in March 2021 before declining to 32 Cr in March 2025. Overall, ION Exchange has demonstrated strong revenue growth and profitability, alongside increasing asset and liability levels.

View full answer

Is ION Exchange technically bullish or bearish?

22-Jul-2025

As of July 21, 2025, the technical trend is mildly bearish, primarily due to daily moving averages, despite mixed signals from weekly and monthly indicators.

As of 21 July 2025, the technical trend has changed from sideways to mildly bearish. The current technical stance is mildly bearish, driven primarily by the daily moving averages indicating a bearish outlook. The weekly MACD is mildly bullish, but the monthly MACD and Bollinger Bands are both mildly bearish, suggesting mixed signals across different time frames. The KST shows bullishness on the weekly but bearishness on the monthly, while the Dow Theory indicates no trend on the weekly and mildly bullish on the monthly. Overall, the strength of the bearish stance is supported by the daily moving averages and the monthly indicators, despite some bullish signals on the weekly charts.

View full answer

Who are the top shareholders of the ION Exchange?

06-Jun-2025

The top shareholders of ION Exchange include Rajesh Sharma with 5.62%, Nippon Life India Trustee Ltd at 5.6%, and individual investors holding 31.65%. Institutional investors, including mutual funds and foreign institutional investors, collectively hold 16.98%.

The top shareholders of ION Exchange include a mix of individual and institutional investors. The promoter with the highest holding is Rajesh Sharma, who owns 5.62% of the company. Additionally, Nippon Life India Trustee Ltd holds 5.6% through various funds, making it the highest public shareholder. The company also has significant individual investor holdings, which account for 31.65%. On the institutional side, mutual funds collectively hold 11.48% across 11 schemes, while foreign institutional investors (FIIs) hold 5.5% through 101 different entities. There are no pledged promoter holdings reported.

View full answer

Has ION Exchange declared dividend?

06-Jun-2025

Ion Exchange (India) Ltd has declared a 150% dividend, with an ex-date of September 3, 2024. Despite this, the dividend yield is 0%, but the company has shown strong total returns over various periods, particularly in the long term.

Ion Exchange (India) Ltd has declared a 150% dividend.<BR><BR>Dividend Details:<BR>- Percentage announced: 150%<BR>- Ex-date: 03 Sep 24<BR><BR>Dividend Yield: 0%<BR><BR>Total Returns by Period:<BR>In the last 6 months, the price return was -23.19%, with a dividend return of 0%, resulting in a total return of -23.19%.<BR><BR>Over the past year, the price return was 10.14%, with a dividend return of 0%, leading to a total return of 10.14%.<BR><BR>In the 2-year period, the price return was 33.11%, with a dividend return of 0%, giving a total return of 33.11%.<BR><BR>For the last 3 years, the price return was 183.51%, with a dividend return of 5.62%, resulting in a total return of 189.13%.<BR><BR>In the 4-year period, the price return was 233.0%, with a dividend return of 9.54%, culminating in a total return of 242.54%.<BR><BR>Over the past 5 years, the price return was 673.27%, with a dividend return of 30.73%, leading to a total return of 704.0%.<BR><BR>Overall, Ion Exchange (India) Ltd has declared a significant dividend, but the dividend yield remains at 0%. The total returns over various periods show a strong performance, particularly in the longer term, indicating solid growth despite recent fluctuations.

View full answer
iScoreScore
Click here to find our call on this stock
Strong Sell
Sell
Hold
Buy
Strong Buy

Dashboard

1

High Management Efficiency with a high ROE of 19.29%

 
2

Company has a Debt to Equity ratio (avg) of 0.02 times

 
3

Poor long term growth as Operating profit has grown by an annual rate -9.74% of over the last 5 years

 
4

The company has declared negative results for the last 3 consecutive quarters

5

With ROCE of 9.8, it has a Very Expensive valuation with a 4.5 Enterprise value to Capital Employed

6

High Institutional Holdings at 20.18%

stock-summaryMojo Parameters

Mojo Parameters

Loading Valuation Snapshot...

Stock DNA

stock-summary
Industry

Other Utilities

stock-summary
Market cap

INR 6,467 Cr (Small Cap)

stock-summary
P/E

60.00

stock-summary
Industry P/E

43

stock-summary
Dividend Yield

0.00%

stock-summary
Debt Equity

0.12

stock-summary
Return on Equity

11.56%

stock-summary
Price to Book

4.90

Revenue and Profits:
Net Sales:
700 Cr
(Quarterly Results - Jun 2026)
Net Profit:
4 Cr
stock-summaryTotal Returns
Total Returns (Price + Dividend) stock-summary
Dividend Yield (0%)
TimePeriod
Price Return
Dividend Return
Total Return
3 Months
23.19%
0%
23.19%
6 Months
30.52%
0%
30.52%
1 Year
2.93%
0%
2.93%
2 Years
-34.87%
0%
-34.87%
3 Years
-15.53%
0%
-15.53%
4 Years
97.15%
0%
97.15%
5 Years
0%
0%
0.0%

Latest dividend: 1.000027529249828 per share ex-dividend date: Aug-29-2022

Risk Adjusted Returns v/s stock-summary
Returns Beta
Icon
Beta has not been calculated since enough price history is not available
stock-summaryNews & Corporate Actions

News

Ion Exchange Surges 10.22% in Volatile Week Amid Mixed Technical Signals

Key Events This Week

31 Aug: Stock opens week at Rs.364.00, down 2.02%

1 Sep: Technical momentum shift noted amid mixed indicator signals

4 Sep: Intraday high of Rs.408.3 with 7.06% surge, marking fourth consecutive day of gains

4 Sep: Technical momentum shifts to mildly bullish stance

stock-summaryKey Factors

Quality key factors stock-summary

Factor
Value
Sales Growth (5y)
15.14%
EBIT Growth (5y)
-9.74%
EBIT to Interest (avg)
17.52
Debt to EBITDA (avg)
0.76
Net Debt to Equity (avg)
0.12
Sales to Capital Employed (avg)
2.03
Tax Ratio
28.29%
Dividend Payout Ratio
10.27%
Pledged Shares
0
Institutional Holding
20.18%
ROCE (avg)
55.24%
ROE (avg)
19.29%

Valuation key factors

Factor
Value
P/E Ratio
60
Industry P/E
43
Price to Book Value
4.90
EV to EBIT
62.68
EV to EBITDA
37.48
EV to Capital Employed
4.48
EV to Sales
2.22
PEG Ratio
NA
Dividend Yield
NA
ROCE (Latest)
9.82%
ROE (Latest)
11.56%

Technicals key factors

Indicator
Weekly
Monthly
MACD
Mildly Bearish
Mildly Bullish
RSI
No Signal
No Signal
Bollinger Bands
Bullish
Bullish
Moving Averages
Bullish (Daily)
KST
Mildly Bearish
Mildly Bullish
Dow Theory
Mildly Bullish
Mildly Bearish
OBV
Bullish
Bullish
stock-summary Technical Indicator Scale: Bearish, Mildly Bearish, Sideways, Mildly Bullish, Bullish  Turned 
stock-summaryShareholding
Shareholding Snapshot : Jun 2026stock-summary
Shareholding Compare (%holding) stock-summary
Majority shareholders

Non Institution

Pledged Promoter Holdings

None

Mutual Funds

Held by 12 Schemes (12.48%)

FIIs

Held by 97 FIIs (4.86%)

Promoter with highest holding

Rajesh Sharma (5.65%)

Highest Public shareholder

Nippon Life India Trustee Ltd-a/c Nippon India Small Cap Fund (4.95%)

Individual Investors Holdings

31.42%

stock-summaryFinancial
[
  {
    "link": "quarterly",
    "btn_text": "All Quarterly Results",
    "header": "Quarterly Results Snapshot (Consolidated) - Jun'26 - YoY",
    "rhs": [
      {
        "prefix": "Net Sales ",
        "suffix": "YoY Growth in quarter ended Jun 2026 is 20.11% vs 2.75% in Jun 2025",
        "dir": 1
      },
      {
        "prefix": "Consolidated Net Profit ",
        "suffix": "YoY Growth in quarter ended Jun 2026 is -91.56% vs 8.32% in Jun 2025",
        "dir": -1
      }
    ],
    "table": {
      "header": [
        "Jun'26",
        "Jun'25",
        "Change(%)"
      ],
      "body": [
        {
          "field": "Net Sales",
          "val1": "700.46",
          "val2": "583.19",
          "chgp": "20.11%",
          "chgp_class": "positive"
        },
        {
          "field": "Operating Profit (PBDIT) excl Other Income",
          "val1": "31.74",
          "val2": "62.54",
          "chgp": "-49.25%",
          "chgp_class": "negative"
        },
        {
          "field": "Interest",
          "val1": "8.95",
          "val2": "2.56",
          "chgp": "249.61%",
          "chgp_class": "negative"
        },
        {
          "field": "Exceptional Items",
          "val1": "0.00",
          "val2": "0.00",
          "chgp": "",
          "chgp_class": "neutral"
        },
        {
          "field": "Consolidate Net Profit",
          "val1": "4.11",
          "val2": "48.70",
          "chgp": "-91.56%",
          "chgp_class": "negative"
        },
        {
          "field": "Operating Profit Margin (Excl OI)",
          "val1": "4.53%",
          "val2": "10.72%",
          "chgp": "-6.19%",
          "chgp_class": "negative"
        }
      ]
    }
  },
  {
    "link": "half-yearly",
    "btn_text": "All Half Yearly Results",
    "header": "Half Yearly Results Snapshot (Consolidated) - Sep'25",
    "rhs": [
      {
        "prefix": "Net Sales ",
        "suffix": " Growth in half year ended Sep 2025 is 8.67% vs 19.74% in Sep 2024",
        "dir": -1
      },
      {
        "prefix": "Consolidated Net Profit ",
        "suffix": " Growth in half year ended Sep 2025 is 2.43% vs 26.57% in Sep 2024",
        "dir": -1
      }
    ],
    "table": {
      "header": [
        "Sep'25",
        "Sep'24",
        "Change(%)"
      ],
      "body": [
        {
          "field": "Net Sales",
          "val1": "1,317.13",
          "val2": "1,212.04",
          "chgp": "8.67%",
          "chgp_class": "positive"
        },
        {
          "field": "Operating Profit (PBDIT) excl Other Income",
          "val1": "131.03",
          "val2": "132.51",
          "chgp": "-1.12%",
          "chgp_class": "negative"
        },
        {
          "field": "Interest",
          "val1": "5.64",
          "val2": "6.55",
          "chgp": "-13.89%",
          "chgp_class": "positive"
        },
        {
          "field": "Exceptional Items",
          "val1": "0.00",
          "val2": "0.00",
          "chgp": "",
          "chgp_class": "neutral"
        },
        {
          "field": "Consolidate Net Profit",
          "val1": "98.23",
          "val2": "95.90",
          "chgp": "2.43%",
          "chgp_class": "positive"
        },
        {
          "field": "Operating Profit Margin (Excl OI)",
          "val1": "9.95%",
          "val2": "10.93%",
          "chgp": "-0.98%",
          "chgp_class": "negative"
        }
      ]
    }
  },
  {
    "link": "nine-monthly",
    "btn_text": "All Nine Monthly Results",
    "header": "Nine Monthly Results Snapshot (Consolidated) - Dec'25",
    "rhs": [
      {
        "prefix": "Net Sales ",
        "suffix": "YoY Growth in nine months ended Dec 2025 is 7.83% vs 21.49% in Dec 2024",
        "dir": -1
      },
      {
        "prefix": "Consolidated Net Profit ",
        "suffix": "YoY Growth in nine months ended Dec 2025 is -17.95% vs 17.23% in Dec 2024",
        "dir": -1
      }
    ],
    "table": {
      "header": [
        "Dec'25",
        "Dec'24",
        "Change(%)"
      ],
      "body": [
        {
          "field": "Net Sales",
          "val1": "2,051.57",
          "val2": "1,902.55",
          "chgp": "7.83%",
          "chgp_class": "positive"
        },
        {
          "field": "Operating Profit (PBDIT) excl Other Income",
          "val1": "190.28",
          "val2": "207.98",
          "chgp": "-8.51%",
          "chgp_class": "negative"
        },
        {
          "field": "Interest",
          "val1": "13.21",
          "val2": "9.85",
          "chgp": "34.11%",
          "chgp_class": "negative"
        },
        {
          "field": "Exceptional Items",
          "val1": "-16.97",
          "val2": "0.00",
          "chgp": "",
          "chgp_class": "neutral"
        },
        {
          "field": "Consolidate Net Profit",
          "val1": "118.53",
          "val2": "144.46",
          "chgp": "-17.95%",
          "chgp_class": "negative"
        },
        {
          "field": "Operating Profit Margin (Excl OI)",
          "val1": "9.27%",
          "val2": "10.93%",
          "chgp": "-1.66%",
          "chgp_class": "negative"
        }
      ]
    }
  },
  {
    "link": "annual",
    "btn_text": "All Annual Results",
    "header": "Annual Results Snapshot (Consolidated) - Mar'26",
    "rhs": [
      {
        "prefix": "Net Sales ",
        "suffix": "YoY Growth in year ended Mar 2026 is 6.49% vs 16.58% in Mar 2025",
        "dir": -1
      },
      {
        "prefix": "Consolidated Net Profit ",
        "suffix": "YoY Growth in year ended Mar 2026 is -31.35% vs 6.01% in Mar 2025",
        "dir": -1
      }
    ],
    "table": {
      "header": [
        "Mar'26",
        "Mar'25",
        "Change(%)"
      ],
      "body": [
        {
          "field": "Net Sales",
          "val1": "2,914.84",
          "val2": "2,737.11",
          "chgp": "6.49%",
          "chgp_class": "positive"
        },
        {
          "field": "Operating Profit (PBDIT) excl Other Income",
          "val1": "210.15",
          "val2": "293.82",
          "chgp": "-28.48%",
          "chgp_class": "negative"
        },
        {
          "field": "Interest",
          "val1": "24.00",
          "val2": "13.46",
          "chgp": "78.31%",
          "chgp_class": "negative"
        },
        {
          "field": "Exceptional Items",
          "val1": "-16.89",
          "val2": "0.00",
          "chgp": "",
          "chgp_class": "neutral"
        },
        {
          "field": "Consolidate Net Profit",
          "val1": "142.67",
          "val2": "207.81",
          "chgp": "-31.35%",
          "chgp_class": "negative"
        },
        {
          "field": "Operating Profit Margin (Excl OI)",
          "val1": "7.21%",
          "val2": "10.73%",
          "chgp": "-3.52%",
          "chgp_class": "negative"
        }
      ]
    }
  }
]

Quarterly Results Snapshot (Consolidated) - Jun'26 - YoYstock-summary

Jun'26
Jun'25
Change(%)
Net Sales
700.46
583.19
20.11%
Operating Profit (PBDIT) excl Other Income
31.74
62.54
-49.25%
Interest
8.95
2.56
249.61%
Exceptional Items
0.00
0.00
Consolidate Net Profit
4.11
48.70
-91.56%
Operating Profit Margin (Excl OI)
4.53%
10.72%
-6.19%
Values in Rs Cr.
Direction Arrows
Net Sales

YoY Growth in quarter ended Jun 2026 is 20.11% vs 2.75% in Jun 2025

Direction Arrows
Consolidated Net Profit

YoY Growth in quarter ended Jun 2026 is -91.56% vs 8.32% in Jun 2025

Half Yearly Results Snapshot (Consolidated) - Sep'25stock-summary

Sep'25
Sep'24
Change(%)
Net Sales
1,317.13
1,212.04
8.67%
Operating Profit (PBDIT) excl Other Income
131.03
132.51
-1.12%
Interest
5.64
6.55
-13.89%
Exceptional Items
0.00
0.00
Consolidate Net Profit
98.23
95.90
2.43%
Operating Profit Margin (Excl OI)
9.95%
10.93%
-0.98%
Values in Rs Cr.
Direction Arrows
Net Sales

Growth in half year ended Sep 2025 is 8.67% vs 19.74% in Sep 2024

Direction Arrows
Consolidated Net Profit

Growth in half year ended Sep 2025 is 2.43% vs 26.57% in Sep 2024

Nine Monthly Results Snapshot (Consolidated) - Dec'25stock-summary

Dec'25
Dec'24
Change(%)
Net Sales
2,051.57
1,902.55
7.83%
Operating Profit (PBDIT) excl Other Income
190.28
207.98
-8.51%
Interest
13.21
9.85
34.11%
Exceptional Items
-16.97
0.00
Consolidate Net Profit
118.53
144.46
-17.95%
Operating Profit Margin (Excl OI)
9.27%
10.93%
-1.66%
Values in Rs Cr.
Direction Arrows
Net Sales

YoY Growth in nine months ended Dec 2025 is 7.83% vs 21.49% in Dec 2024

Direction Arrows
Consolidated Net Profit

YoY Growth in nine months ended Dec 2025 is -17.95% vs 17.23% in Dec 2024

Annual Results Snapshot (Consolidated) - Mar'26stock-summary

Mar'26
Mar'25
Change(%)
Net Sales
2,914.84
2,737.11
6.49%
Operating Profit (PBDIT) excl Other Income
210.15
293.82
-28.48%
Interest
24.00
13.46
78.31%
Exceptional Items
-16.89
0.00
Consolidate Net Profit
142.67
207.81
-31.35%
Operating Profit Margin (Excl OI)
7.21%
10.73%
-3.52%
Values in Rs Cr.
Direction Arrows
Net Sales

YoY Growth in year ended Mar 2026 is 6.49% vs 16.58% in Mar 2025

Direction Arrows
Consolidated Net Profit

YoY Growth in year ended Mar 2026 is -31.35% vs 6.01% in Mar 2025

stock-summaryCompany CV
About Ion Exchange (India) Ltd stock-summary
stock-summary
Ion Exchange (India) Ltd
Small Cap
Other Utilities
Ion Exchange (India) Limited, established on March 6, 1964 is a leader in Indian water treatment Industry offers total water management solutions for Industry, Homes and Communities. It is one of the very few companies in the world with a range of technologies, products and services that cover the entire spectrum of water and waste-water treatment. A subsidiary of British Permutit till 1985, it became a wholly Indian company when Permutit divested its holdings.
Company Coordinates stock-summary
Company Details
Ion House P O Box 6273, Dr E Moses Road Mahalaxmi Mumbai Maharashtra : 400011
stock-summary
Tel: 91-22-39890909
stock-summary
ieil@ionexchange.co.in
Registrar Details
TSR Darashaw Ltd, 6-10 , Haji Moosa Patrawala Indl. Est , 20 Dr.E.Moses Road , Mahalaxmi , Mumbai