
Compare IP Rings with Similar Stocks
Dashboard
Weak Long Term Fundamental Strength with an average Return on Capital Employed (ROCE) of 3.98%
- Poor long term growth as Net Sales has grown by an annual rate of 1.37% and Operating profit at 7.97% over the last 5 years
- Low ability to service debt as the company has a high Debt to EBITDA ratio of 4.09 times
Underperformed the market in the last 1 year
Stock DNA
Auto Components & Equipments
INR 164 Cr (Micro Cap)
60.00
36
0.00%
1.18
2.53%
1.48
Total Returns (Price + Dividend) 
Latest dividend: 1 per share ex-dividend date: Aug-04-2023
Risk Adjusted Returns v/s
Returns Beta

News
Are IP Rings Ltd latest results good or bad?
The latest financial results for IP Rings Ltd for Q4 FY26 reveal a complex picture of the company's operational performance. The consolidated net profit stood at ₹1.13 crores, marking a significant turnaround from a loss of ₹3.93 crores in the same quarter last year. However, this improvement is largely attributed to a favorable base effect and a notable reliance on other income, which accounted for a substantial portion of the profit before tax. Net sales for the quarter reached ₹86.54 crores, reflecting a modest year-on-year growth of 2.77%. This growth is relatively subdued compared to the broader recovery trends within the automotive sector, indicating that IP Rings may be struggling to leverage industry tailwinds effectively. Sequentially, net sales showed a slight increase of 1.82% from the previous quarter, suggesting a gradual upward trend. Operating margins, excluding other income, were reported ...
Read full news article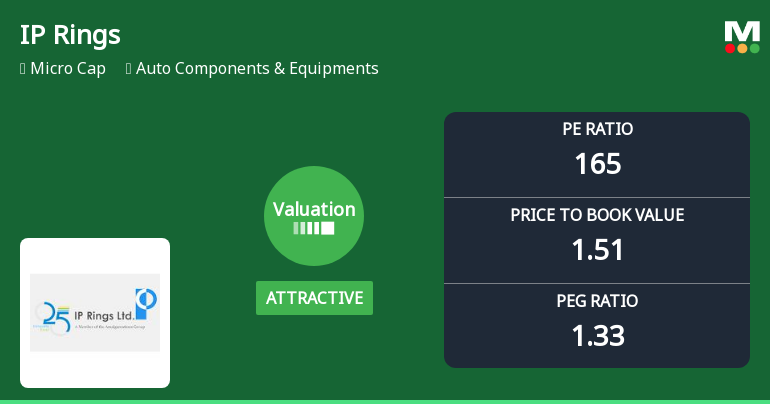
IP Rings Ltd Valuation Shifts Signal Renewed Price Attractiveness Amid Mixed Returns
IP Rings Ltd, a micro-cap player in the Auto Components & Equipments sector, has witnessed a notable shift in its valuation parameters, moving from a fair to an attractive rating. Despite a challenging fundamental backdrop, the stock’s price-to-earnings (P/E) and price-to-book value (P/BV) ratios suggest a more compelling entry point for investors, especially when contrasted with its historical averages and peer group valuations.
Read full news article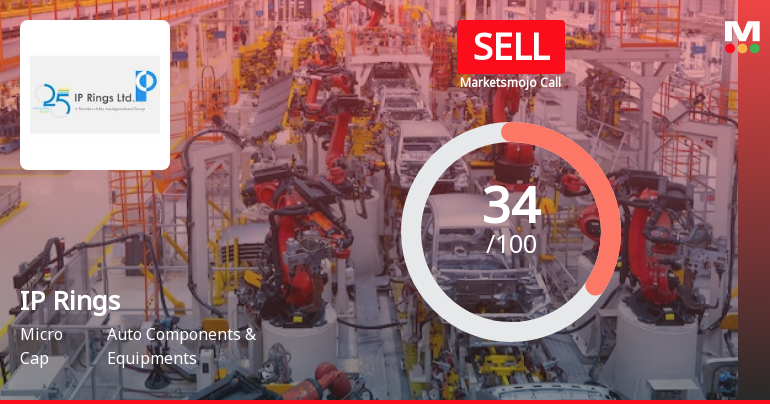
IP Rings Ltd is Rated Sell
IP Rings Ltd is rated 'Sell' by MarketsMOJO, with this rating last updated on 30 May 2026. However, the analysis and financial metrics discussed here reflect the stock's current position as of 31 May 2026, providing investors with the most up-to-date view of the company’s fundamentals, returns, and overall outlook.
Read full news article Announcements
Announcement under Regulation 30 (LODR)-Newspaper Publication
30-May-2026 | Source : BSENewspaper Publication of the extract of the Unaudited Financial Results - Regulation 47 of SEBI LODR.
Audited Financial Results (Standalone And Consolidated) For The Financial Year Ended March 31 2026.
29-May-2026 | Source : BSEThe Audit Committee and the Board of Directors of the Company at their respective meeting(s) held on May 29 2026 approved the Audited (Standalone and Consolidated) Financial Results for the Financial Year ended March 31 2026.
Announcement under Regulation 30 (LODR)-Change in Management
29-May-2026 | Source : BSEThe Board at its meeting held today has; 1. Re-appointed Internal Auditor and 2. Re-appointed Cost Auditor.
Corporate Actions

No Upcoming Board Meetings

IP Rings Ltd has declared 10% dividend, ex-date: 04 Aug 23

No Splits history available

No Bonus history available

IP Rings Ltd has announced 4:5 rights issue, ex-date: 16 Jan 17
Quality key factors
Valuation key factors
Technicals key factors
 Technical Indicator Scale: Bearish, Mildly Bearish, Sideways, Mildly Bullish, Bullish Turned
 Shareholding Snapshot : Mar 2026
Shareholding Compare (%holding)
Promoters
None
Held by 1 Schemes (0.0%)
Held by 0 FIIs
Simpson And Company Ltd (39.18%)
Enam Securities Pvt Ltd (8.41%)
22.51%
Quarterly Results Snapshot (Consolidated) - Mar'26 - QoQ

QoQ Growth in quarter ended Mar 2026 is 1.82% vs 1.49% in Dec 2025
QoQ Growth in quarter ended Mar 2026 is 927.27% vs -64.52% in Dec 2025
Half Yearly Results Snapshot (Consolidated) - Sep'25

Growth in half year ended Sep 2025 is 2.41% vs 4.80% in Sep 2024
Growth in half year ended Sep 2025 is 155.95% vs 73.99% in Sep 2024
Nine Monthly Results Snapshot (Consolidated) - Dec'25
YoY Growth in nine months ended Dec 2025 is 14.18% vs -3.83% in Dec 2024
YoY Growth in nine months ended Dec 2025 is 112.16% vs -15.50% in Dec 2024
Annual Results Snapshot (Consolidated) - Mar'26
YoY Growth in year ended Mar 2026 is 11.01% vs -4.21% in Mar 2025
YoY Growth in year ended Mar 2026 is 138.83% vs -37.15% in Mar 2025
About IP Rings Ltd

Company Coordinates


