Ircon Intl.

  • Market Cap: Small Cap
  • Industry: Construction
  • ISIN: INE962Y01021
  • NSEID: IRCON
  • BSEID: 541956
INR
113.15
-2.15 (-1.86%)
BSENSE

Sep 11, 10:47 AM

BSE+NSE Vol: 7.18 lacs

  • Price Points
  • Score
  • Mojo Parameters
  • Total Return
  • News and Corporate Actions
  • Key factors
  • Shareholding
  • Financials
  • CompanyCV
stock-summaryPrice Point
High/Low

1Day

52 Week

Valuation
Technical
Day's Volume

CASH

7.18 lacs (-2.46%) Volume

Shareholding (Jun 2026)

FII

4.60%

Held by 108 FIIs

DII

2.07%

Held by 16 DIIs

Promoter

65.17%

Why is Ircon International Ltd falling/rising?

06-Sep-2026

As of 05-Sep, Ircon International Ltd's stock price is rising slightly but has a year-to-date decline of 32.88% and a one-year drop of 28.58%. Overall, the stock faces significant challenges, reflected in decreased investor participation and poor financial performance.

As of 05-Sep, Ircon International Ltd's stock price is rising, currently at 119.20, with a change of 0.55 (0.46%) upwards. This increase follows a trend of consecutive gains over the last two days, during which the stock has risen by 0.97%. Additionally, it has outperformed its sector by 0.63% today. <BR><BR>However, despite this short-term rise, the stock has been underperforming over longer periods, with a year-to-date decline of 32.88% and a one-year drop of 28.58%. The stock is also trading lower than its moving averages across various time frames, indicating a general downward trend. Furthermore, there has been a notable decrease in investor participation, with delivery volume falling by 26.44% compared to the five-day average.<BR><BR>The company's financials reveal a concerning picture, with profits having fallen by 21.6% over the past year, and negative results reported in the most recent quarter. This includes a significant drop in profit before tax and profit after tax compared to previous quarters. The low stake held by domestic mutual funds, at only 0.83%, suggests a lack of confidence in the stock's future performance.<BR><BR>In summary, while there is a slight rise in the stock price in the short term, the overall performance and investor sentiment indicate significant challenges for Ircon International Ltd, leading to a mixed outlook.

View full answer

Who are in the management team of Ircon Intl.?

01-Sep-2026

The management team of Ircon International includes Brijesh Kumar Gupta (Chairman, Managing Director & CEO), Parag Verma (Executive Director - Works), Ragini Advani (Executive Director - Finance), Anand Kumar Singh (Executive Director - Projects), and Pooja Gurwala (Company Secretary). The board also features several non-executive and independent directors.

The management team of Ircon International includes the following key members:<BR><BR>1. **Brijesh Kumar Gupta** - Chairman, Managing Director & CEO<BR>2. **Parag Verma** - Executive Director (Works)<BR>3. **Ragini Advani** - Executive Director (Finance)<BR>4. **Anand Kumar Singh** - Executive Director (Projects)<BR>5. **Pooja Gurwala** - Company Secretary & Compliance Officer<BR><BR>Additionally, the board includes several non-executive and independent directors:<BR><BR>- **Dhananjaya Singh** - Non-Executive Director/Part-Time Officer<BR>- **Ajay Kumar Chauhan** - Non-Official Independent Director<BR>- **Dipendra Kumar Gupta** - Non-Official Independent Director<BR>- **Ranjana Upadhyay** - Non-Official Independent Director<BR>- **Kartik Chandulal Bhadra** - Non-Official Independent Director<BR><BR>This team is responsible for overseeing the operations and strategic direction of the company.

View full answer

What does Ircon Intl. do?

01-Sep-2026

Ircon International Ltd is a small-cap company specializing in railway construction and infrastructure development, with a market cap of INR 11,418 Cr. As of June 2026, it reported net sales of 1,956 Cr and a net profit of 93 Cr.

Overview:<BR>Ircon International Ltd is a small-cap company operating in the construction industry, primarily focused on railway construction and infrastructure development.<BR><BR>History:<BR>Ircon International Limited was incorporated in 1976 as the 'Indian Railway Construction Company Private Limited' and became a public limited company later that same year. The company changed its name to Ircon International Limited in 1995. The latest quarterly results reported net sales and net profit for June 2026.<BR><BR>Financial Snapshot:<BR>- Net Sales: 1,956 Cr (Quarterly Results - Jun 2026)<BR>- Net Profit: 93 Cr (Quarterly Results - Jun 2026)<BR>- Market Cap: INR 11,418 Cr (Small Cap)<BR><BR>Key Metrics:<BR>- P/E: 21.00<BR>- Industry P/E: 35<BR>- Dividend Yield: 1.80%<BR>- Debt Equity: 0.08<BR>- Return on Equity: 8.97%<BR>- Price to Book: 1.73<BR><BR>Contact Details:<BR>Address: Plot No C-4, District Centre Saket New Delhi New Delhi : 110017<BR>Tel: 91-11-29565666<BR>Email: info@ircon.org<BR>Website: http://www.ircon.org

View full answer

Who are the peers of the Ircon Intl.?

01-Sep-2026

Ircon Intl.'s peers include IndiGrid Trust, Engineers India, Techno Elec. Engg, KEC International, Afcons Infrastructure, Rites, SG Mart, NCC, and Vertis Infra. In terms of management risk, growth, and capital structure, Ircon Intl. shows average performance compared to its peers, with a 1-year return of -25.51%.

Peers: The peers of Ircon Intl. are IndiGrid Trust, Engineers India, Techno Elec.Engg, KEC Internationa, Afcons Infrastr., Rites, SG Mart, NCC, and Vertis Infra.<BR><BR>Quality Snapshot: Excellent management risk is observed at IndiGrid Trust, Engineers India, Techno Elec.Engg, KEC Internationa, and Rites, while Average management risk is found at Ircon Intl., Afcons Infrastr., and Vertis Infra. Good management risk is noted at SG Mart and NCC, while Below Average management risk is present at Techno Elec.Engg. Growth is Excellent at SG Mart and NCC, Average at IndiGrid Trust, Techno Elec.Engg, and KEC Internationa, while Below Average growth is seen at Engineers India, Ircon Intl., Afcons Infrastr., Rites, and Vertis Infra. Capital Structure is Excellent at IndiGrid Trust, Engineers India, and Rites, Good at Ircon Intl. and SG Mart, while Below Average is noted at KEC Internationa, Afcons Infrastr., and Vertis Infra.<BR><BR>Return Snapshot: SG Mart has the highest 1-year return at 144.18%, while Techno Elec.Engg has the lowest at -34.99%. Ircon Intl.'s 1-year return of -25.51% is better than Techno Elec.Engg but worse than SG Mart. Additionally, KEC Internationa, Afcons Infrastr., and Rites have negative six-month returns.

View full answer

How big is Ircon Intl.?

01-Sep-2026

As of 31st August, Ircon International Ltd has a market capitalization of 11,418.00 Cr, with recent net sales of 9,240.60 Cr and a net profit of 523.65 Cr.

As of 31st August, Ircon International Ltd has a market capitalization of 11,418.00 Cr, categorizing it as a Small Cap company.<BR><BR>In the latest four quarters, Ircon International Ltd reported Net Sales of 9,240.60 Cr and a Net Profit of 523.65 Cr.<BR><BR>The latest annual period for the balance sheet is March 2025, with Shareholder's Funds amounting to 6,326.35 Cr and Total Assets of 19,376.77 Cr.

View full answer

Should I buy, sell or hold Ircon International Ltd?

14-Aug-2026

When is the next results date for Ircon International Ltd?

05-Aug-2026

The next results date for Ircon International Ltd is 12 August 2026.

The next results date for Ircon International Ltd is scheduled for 12 August 2026.

View full answer

Are Ircon International Ltd latest results good or bad?

23-May-2026

Ircon International Ltd's latest results show a strong sequential profit increase and revenue growth, but year-on-year declines in both metrics raise concerns about sustainability. Overall, while there are positive signs, the company's long-term outlook appears cautious due to margin pressures and decreased capital efficiency.

Ircon International Ltd's latest results present a mixed picture, indicating both some positive developments and significant concerns. <BR><BR>On the positive side, the company reported a substantial sequential increase in net profit, which rose by 90.34% quarter-on-quarter to ₹191.60 crores, and revenue surged by 50.49% to ₹3,188.98 crores in Q4 FY26. This reflects a strong year-end execution push typical in the infrastructure sector. Additionally, the operating margin improved to 8.37%, up 92 basis points from the previous quarter, suggesting better project execution and cost management.<BR><BR>However, there are notable red flags. Year-on-year, both net profit and revenue declined by 9.13% and 6.54%, respectively. This raises concerns about the sustainability of growth and the company's ability to maintain momentum. The operating margin remains below the historical average of 9-10%, indicating ongoing margin pressures. Furthermore, the company's return on capital employed (ROCE) has dramatically decreased to 9.76%, down from an average of over 40% in the past five years, signaling significant deterioration in capital efficiency.<BR><BR>The stock has also underperformed significantly, declining 24% over the past year, which is much worse than the broader market's decline. Investor sentiment appears cautious, reflecting concerns about margin sustainability and execution challenges.<BR><BR>In summary, while there are some positive signs in the latest quarterly results, the overall performance raises concerns about long-term sustainability and execution efficiency, leading to a cautious outlook for the company.

View full answer

Has Ircon International Ltd declared dividend?

13-Feb-2026

Ircon International Ltd has declared a 60% dividend, with an ex-date of February 17, 2026. While recent total returns have been negative over shorter periods, the company has shown substantial growth in total returns over the 3, 4, and 5-year periods.

Ircon International Ltd has declared a 60% dividend.<BR><BR>Dividend Details:<BR>- Percentage announced: 60%<BR>- Ex-date: 17 Feb 26<BR><BR>Dividend Yield: 1.71%.<BR><BR>Total Returns by Period:<BR>In the 3-month period, the price return was -5.0%, the dividend return was 0.71%, resulting in a total return of -4.29%.<BR><BR>In the 6-month period, the price return was -8.65%, the dividend return was 1.32%, leading to a total return of -7.33%.<BR><BR>For the 1-year period, the price return was -8.54%, the dividend return was 1.45%, which resulted in a total return of -7.09%.<BR><BR>Over the 2-year period, the price return was -27.46%, the dividend return was 2.22%, culminating in a total return of -25.24%.<BR><BR>In the 3-year period, the price return was 186.61%, the dividend return was 15.26%, resulting in a total return of 201.87%.<BR><BR>For the 4-year period, the price return was 241.25%, the dividend return was 26.75%, leading to a total return of 268.0%.<BR><BR>In the 5-year period, the price return was 187.69%, the dividend return was 32.40%, culminating in a total return of 220.09%.<BR><BR>Overall, Ircon International Ltd has declared a significant dividend, and while recent total returns over shorter periods have been negative, the longer-term returns indicate substantial growth, particularly over the 3, 4, and 5-year periods.

View full answer

How has been the historical performance of Ircon Intl.?

17-Nov-2025

Ircon Intl. has shown fluctuating financial performance, with net sales declining from 12,513.65 Cr in Mar'24 to 10,759.58 Cr in Mar'25, and operating profit decreasing from 1,463.74 Cr to 1,216.26 Cr in the same period. Despite a profit after tax of 668.06 Cr in Mar'25, the company faces liquidity challenges with significant negative cash flow of -1,109.00 Cr.

Answer:<BR>The historical performance of Ircon Intl. shows a fluctuating trend in net sales and profits over the years, with net sales reaching 10,759.58 Cr in Mar'25, down from 12,513.65 Cr in Mar'24, but up from 10,367.93 Cr in Mar'23. The operating profit (PBDIT) was 1,216.26 Cr in Mar'25, a decrease from 1,463.74 Cr in Mar'24, yet an increase from 1,085.10 Cr in Mar'23. Profit after tax (PAT) was 668.06 Cr in Mar'25, down from 883.29 Cr in Mar'24 but higher than 733.79 Cr in Mar'23. The company's total assets increased to 19,376.77 Cr in Mar'25 from 17,332.63 Cr in Mar'24, while total liabilities also rose to 19,376.77 Cr from 17,332.63 Cr in the same period. Cash flow from operating activities showed a significant outflow of -1,109.00 Cr in Mar'25, compared to -78.00 Cr in Mar'24, indicating a challenging cash flow situation.<BR><BR>Breakdown:<BR>Ircon Intl. has experienced a notable increase in net sales over the years, with a peak of 12,513.65 Cr in Mar'24, followed by a decline to 10,759.58 Cr in Mar'25. Operating profit saw a similar pattern, with a high of 1,463.74 Cr in Mar'24, decreasing to 1,216.26 Cr in Mar'25. Despite these fluctuations, profit after tax remained relatively strong, with 668.06 Cr in Mar'25, although it was lower than the previous year's 883.29 Cr. The company's total assets and liabilities both grew, reflecting an increase in financial obligations alongside asset accumulation. The cash flow from operating activities turned negative in Mar'25, indicating potential liquidity challenges, contrasting sharply with the positive cash flow seen in prior years. Overall, while Ircon Intl. has shown growth in sales and assets, the recent decline in profits and cash flow raises concerns about its operational efficiency and financial health.

View full answer

Is Ircon Intl. overvalued or undervalued?

14-Nov-2025

As of November 13, 2025, Ircon International is fairly valued with a PE ratio of 25.26 and an EV to EBITDA ratio of 19.44, despite a year-to-date return of -24.98%, positioning it reasonably compared to peers like Rail Vikas and Craftsman Auto.

As of 13 November 2025, Ircon International's valuation grade has moved from attractive to fair, indicating a shift in its perceived value. The company is currently fairly valued based on its financial metrics, with a PE ratio of 25.26, an EV to EBITDA ratio of 19.44, and a dividend yield of 1.64%. <BR><BR>In comparison to its peers, Ircon International's valuation appears reasonable, especially when contrasted with Rail Vikas, which is considered expensive with a PE ratio of 57.69, and Craftsman Auto, also fairly valued with a PE ratio of 62.13. Despite recent underperformance with a year-to-date return of -24.98% compared to the Sensex's 8.11%, the company's financial ratios suggest it is positioned adequately within its industry.

View full answer

Is Ircon Intl. technically bullish or bearish?

14-Nov-2025

As of November 13, 2025, Ircon Intl. has shifted to a bearish trend, supported by bearish MACD, Bollinger Bands, and moving averages, despite mixed signals from the KST and Dow Theory.

As of 13 November 2025, the technical trend for Ircon Intl. has changed from mildly bearish to bearish. The current stance is bearish with moderate strength. Key indicators driving this include a bearish MACD on the weekly chart, bearish Bollinger Bands on both weekly and monthly time frames, and bearish moving averages on the daily chart. The KST shows a mildly bullish signal on the weekly but is mildly bearish on the monthly, indicating mixed signals. The Dow Theory indicates no trend on the weekly and mildly bearish on the monthly. Overall, the combination of these indicators suggests a bearish outlook for the stock.

View full answer

Who are the top shareholders of the Ircon Intl.?

17-Jul-2025

The top shareholder of Ircon International is the President of India, holding 65.17%. Other shareholders include 15 mutual fund schemes (0.2%), 121 foreign institutional investors (4.57%), and individual investors (26.05%), with no pledged promoter holdings.

The top shareholders of Ircon International include the President of India, who holds the largest stake at 65.17%, representing the promoter category. There are also 15 mutual fund schemes collectively holding 0.2% of the shares, and 121 foreign institutional investors (FIIs) with a combined holding of 4.57%. Additionally, individual investors own 26.05% of the company. There are no pledged promoter holdings, and there is no significant public shareholder listed.

View full answer

What is the bonus history of the Ircon Intl.?

06-Jun-2025

Ircon International Ltd announced a 1:1 bonus issue on May 20, 2021, with a record date of May 21, 2021. Shareholders received one additional share for each share owned, effectively doubling their holdings.

Ircon International Ltd has a bonus history that includes a notable 1:1 bonus issue announced on May 20, 2021. The record date for this bonus was May 21, 2021, meaning shareholders on that date were eligible to receive the bonus shares. This bonus issue effectively doubled the number of shares held by shareholders, as they received one additional share for each share they owned.

View full answer
iScoreScore
Click here to find our call on this stock
Strong Sell
Sell
Hold
Buy
Strong Buy

Dashboard

1

Poor long term growth as Net Sales has grown by an annual rate of 9.17% and Operating profit at 5.67% over the last 5 years

 
2

Negative results in Jun 26

3

Despite the size of the company, domestic mutual funds hold only 0.83% of the company

4

Below par performance in long term as well as near term

stock-summaryMojo Parameters

Mojo Parameters

Loading Valuation Snapshot...

Stock DNA

stock-summary
Industry

Construction

stock-summary
Market cap

INR 10,642 Cr (Small Cap)

stock-summary
P/E

21.00

stock-summary
Industry P/E

35

stock-summary
Dividend Yield

1.91%

stock-summary
Debt Equity

0.08

stock-summary
Return on Equity

8.97%

stock-summary
Price to Book

1.63

Revenue and Profits:
Net Sales:
1,956 Cr
(Quarterly Results - Jun 2026)
Net Profit:
93 Cr
stock-summaryTotal Returns
Total Returns (Price + Dividend) stock-summary
Dividend Yield (1.91%)
TimePeriod
Price Return
Dividend Return
Total Return
3 Months
-13.16%
0.51%
-12.65%
6 Months
-17.56%
0.56%
-17.0%
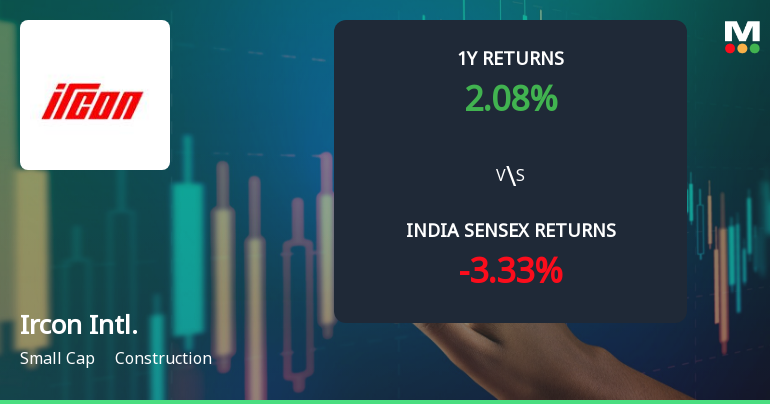
1 Year
-33.21%
1.03%
-32.18%
2 Years
-52.49%
1.97%
-50.52%
3 Years
-29.33%
5.36%
-23.97%
4 Years
171.02%
26.11%
197.13%
5 Years
149.5%
27.07%
176.57%

Latest dividend: 1.2 per share ex-dividend date: Feb-17-2026

Risk Adjusted Returns v/s stock-summary
Returns Beta
Icon
Beta has not been calculated since enough price history is not available
stock-summaryNews & Corporate Actions

Announcements stock-summary

Announcement under Regulation 30 (LODR)-Appointment of Statutory Auditor/s

08-Sep-2026 | Source : BSE

M/s. Vinod Singhal & Co LLP appointed as Statutory Auditor of the Company for the FY 2026-27

Announcement under Regulation 30 (LODR)-Newspaper Publication

02-Sep-2026 | Source : BSE

Newspaper Publication of Notice of the 50th Annual General Meeting to be held on Thursday 24th September 2026

Reg-34(1) Annual Report

01-Sep-2026 | Source : BSE

The Annual Report of IRCON for the FY 2025-26

Corporate Actions stock-summary

stock-summary
BOARD MEETING

No Upcoming Board Meetings

stock-summary
DIVIDEND

Ircon International Ltd has declared 35% dividend, ex-date: 17 Sep 26

stock-summary
SPLITS

Ircon International Ltd has announced 2:10 stock split, ex-date: 03 Apr 20

stock-summary
BONUS

Ircon International Ltd has announced 1:1 bonus issue, ex-date: 20 May 21

stock-summary
RIGHTS

No Rights history available

stock-summaryKey Factors

Quality key factors stock-summary

Factor
Value
Sales Growth (5y)
9.17%
EBIT Growth (5y)
5.67%
EBIT to Interest (avg)
4.37
Debt to EBITDA (avg)
3.55
Net Debt to Equity (avg)
0.08
Sales to Capital Employed (avg)
1.22
Tax Ratio
23.75%
Dividend Payout Ratio
34.26%
Pledged Shares
0
Institutional Holding
6.67%
ROCE (avg)
40.55%
ROE (avg)
12.76%

Valuation key factors

Factor
Value
P/E Ratio
21
Industry P/E
35
Price to Book Value
1.63
EV to EBIT
18.97
EV to EBITDA
14.78
EV to Capital Employed
1.59
EV to Sales
1.23
PEG Ratio
NA
Dividend Yield
1.91%
ROCE (Latest)
8.39%
ROE (Latest)
8.97%

Technicals key factors

Indicator
Weekly
Monthly
MACD
Bearish
Bearish
RSI
No Signal
No Signal
Bollinger Bands
Bearish
Bearish
Moving Averages
Bearish (Daily)
KST
Bearish
Bearish
Dow Theory
Mildly Bearish
Mildly Bearish
OBV
Mildly Bearish
Mildly Bearish
stock-summary Technical Indicator Scale: Bearish, Mildly Bearish, Sideways, Mildly Bullish, Bullish  Turned 
stock-summaryShareholding
Shareholding Snapshot : Jun 2026stock-summary
Shareholding Compare (%holding) stock-summary
Majority shareholders

Promoters

Pledged Promoter Holdings

None

Mutual Funds

Held by 17 Schemes (0.29%)

FIIs

Held by 108 FIIs (4.6%)

Promoter with highest holding

The President Of India(through Chairman Railway Board) (65.17%)

Highest Public shareholder

None

Individual Investors Holdings

26.03%

stock-summaryFinancial
[
  {
    "link": "quarterly",
    "btn_text": "All Quarterly Results",
    "header": "Quarterly Results Snapshot (Consolidated) - Jun'26 - YoY",
    "rhs": [
      {
        "prefix": "Net Sales ",
        "suffix": "YoY Growth in quarter ended Jun 2026 is 9.49% vs -21.90% in Jun 2025",
        "dir": 1
      },
      {
        "prefix": "Consolidated Net Profit ",
        "suffix": "YoY Growth in quarter ended Jun 2026 is -43.64% vs -26.54% in Jun 2025",
        "dir": -1
      }
    ],
    "table": {
      "header": [
        "Jun'26",
        "Jun'25",
        "Change(%)"
      ],
      "body": [
        {
          "field": "Net Sales",
          "val1": "1,955.83",
          "val2": "1,786.28",
          "chgp": "9.49%",
          "chgp_class": "positive"
        },
        {
          "field": "Operating Profit (PBDIT) excl Other Income",
          "val1": "205.14",
          "val2": "199.89",
          "chgp": "2.63%",
          "chgp_class": "positive"
        },
        {
          "field": "Interest",
          "val1": "106.98",
          "val2": "75.21",
          "chgp": "42.24%",
          "chgp_class": "negative"
        },
        {
          "field": "Exceptional Items",
          "val1": "0.00",
          "val2": "0.00",
          "chgp": "",
          "chgp_class": "neutral"
        },
        {
          "field": "Consolidate Net Profit",
          "val1": "92.74",
          "val2": "164.56",
          "chgp": "-43.64%",
          "chgp_class": "negative"
        },
        {
          "field": "Operating Profit Margin (Excl OI)",
          "val1": "10.49%",
          "val2": "11.19%",
          "chgp": "-0.70%",
          "chgp_class": "negative"
        }
      ]
    }
  },
  {
    "link": "half-yearly",
    "btn_text": "All Half Yearly Results",
    "header": "Half Yearly Results Snapshot (Consolidated) - Sep'25",
    "rhs": [
      {
        "prefix": "Net Sales ",
        "suffix": " Growth in half year ended Sep 2025 is -20.52% vs -16.99% in Sep 2024",
        "dir": -1
      },
      {
        "prefix": "Consolidated Net Profit ",
        "suffix": " Growth in half year ended Sep 2025 is -29.48% vs -1.85% in Sep 2024",
        "dir": -1
      }
    ],
    "table": {
      "header": [
        "Sep'25",
        "Sep'24",
        "Change(%)"
      ],
      "body": [
        {
          "field": "Net Sales",
          "val1": "3,763.03",
          "val2": "4,734.65",
          "chgp": "-20.52%",
          "chgp_class": "negative"
        },
        {
          "field": "Operating Profit (PBDIT) excl Other Income",
          "val1": "341.07",
          "val2": "451.39",
          "chgp": "-24.44%",
          "chgp_class": "negative"
        },
        {
          "field": "Interest",
          "val1": "159.75",
          "val2": "100.86",
          "chgp": "58.39%",
          "chgp_class": "negative"
        },
        {
          "field": "Exceptional Items",
          "val1": "0.00",
          "val2": "0.00",
          "chgp": "",
          "chgp_class": "neutral"
        },
        {
          "field": "Consolidate Net Profit",
          "val1": "303.21",
          "val2": "429.97",
          "chgp": "-29.48%",
          "chgp_class": "negative"
        },
        {
          "field": "Operating Profit Margin (Excl OI)",
          "val1": "9.06%",
          "val2": "9.53%",
          "chgp": "-0.47%",
          "chgp_class": "negative"
        }
      ]
    }
  },
  {
    "link": "nine-monthly",
    "btn_text": "All Nine Monthly Results",
    "header": "Nine Monthly Results Snapshot (Consolidated) - Dec'25",
    "rhs": [
      {
        "prefix": "Net Sales ",
        "suffix": "YoY Growth in nine months ended Dec 2025 is -19.94% vs -14.90% in Dec 2024",
        "dir": -1
      },
      {
        "prefix": "Consolidated Net Profit ",
        "suffix": "YoY Growth in nine months ended Dec 2025 is -21.82% vs -24.34% in Dec 2024",
        "dir": 1
      }
    ],
    "table": {
      "header": [
        "Dec'25",
        "Dec'24",
        "Change(%)"
      ],
      "body": [
        {
          "field": "Net Sales",
          "val1": "5,882.07",
          "val2": "7,347.51",
          "chgp": "-19.94%",
          "chgp_class": "negative"
        },
        {
          "field": "Operating Profit (PBDIT) excl Other Income",
          "val1": "498.86",
          "val2": "583.32",
          "chgp": "-14.48%",
          "chgp_class": "negative"
        },
        {
          "field": "Interest",
          "val1": "252.77",
          "val2": "156.83",
          "chgp": "61.17%",
          "chgp_class": "negative"
        },
        {
          "field": "Exceptional Items",
          "val1": "0.00",
          "val2": "0.00",
          "chgp": "",
          "chgp_class": "neutral"
        },
        {
          "field": "Consolidate Net Profit",
          "val1": "403.87",
          "val2": "516.56",
          "chgp": "-21.82%",
          "chgp_class": "negative"
        },
        {
          "field": "Operating Profit Margin (Excl OI)",
          "val1": "8.48%",
          "val2": "7.94%",
          "chgp": "0.54%",
          "chgp_class": "positive"
        }
      ]
    }
  },
  {
    "link": "annual",
    "btn_text": "All Annual Results",
    "header": "Annual Results Snapshot (Consolidated) - Mar'26",
    "rhs": [
      {
        "prefix": "Net Sales ",
        "suffix": "YoY Growth in year ended Mar 2026 is -15.69% vs -14.02% in Mar 2025",
        "dir": -1
      },
      {
        "prefix": "Consolidated Net Profit ",
        "suffix": "YoY Growth in year ended Mar 2026 is -18.14% vs -21.75% in Mar 2025",
        "dir": 1
      }
    ],
    "table": {
      "header": [
        "Mar'26",
        "Mar'25",
        "Change(%)"
      ],
      "body": [
        {
          "field": "Net Sales",
          "val1": "9,071.05",
          "val2": "10,759.58",
          "chgp": "-15.69%",
          "chgp_class": "negative"
        },
        {
          "field": "Operating Profit (PBDIT) excl Other Income",
          "val1": "765.75",
          "val2": "844.81",
          "chgp": "-9.36%",
          "chgp_class": "negative"
        },
        {
          "field": "Interest",
          "val1": "350.11",
          "val2": "219.13",
          "chgp": "59.77%",
          "chgp_class": "negative"
        },
        {
          "field": "Exceptional Items",
          "val1": "0.00",
          "val2": "0.00",
          "chgp": "",
          "chgp_class": "neutral"
        },
        {
          "field": "Consolidate Net Profit",
          "val1": "595.47",
          "val2": "727.41",
          "chgp": "-18.14%",
          "chgp_class": "negative"
        },
        {
          "field": "Operating Profit Margin (Excl OI)",
          "val1": "8.44%",
          "val2": "7.85%",
          "chgp": "0.59%",
          "chgp_class": "positive"
        }
      ]
    }
  }
]

Quarterly Results Snapshot (Consolidated) - Jun'26 - YoYstock-summary

Jun'26
Jun'25
Change(%)
Net Sales
1,955.83
1,786.28
9.49%
Operating Profit (PBDIT) excl Other Income
205.14
199.89
2.63%
Interest
106.98
75.21
42.24%
Exceptional Items
0.00
0.00
Consolidate Net Profit
92.74
164.56
-43.64%
Operating Profit Margin (Excl OI)
10.49%
11.19%
-0.70%
Values in Rs Cr.
Direction Arrows
Net Sales

YoY Growth in quarter ended Jun 2026 is 9.49% vs -21.90% in Jun 2025

Direction Arrows
Consolidated Net Profit

YoY Growth in quarter ended Jun 2026 is -43.64% vs -26.54% in Jun 2025

Half Yearly Results Snapshot (Consolidated) - Sep'25stock-summary

Sep'25
Sep'24
Change(%)
Net Sales
3,763.03
4,734.65
-20.52%
Operating Profit (PBDIT) excl Other Income
341.07
451.39
-24.44%
Interest
159.75
100.86
58.39%
Exceptional Items
0.00
0.00
Consolidate Net Profit
303.21
429.97
-29.48%
Operating Profit Margin (Excl OI)
9.06%
9.53%
-0.47%
Values in Rs Cr.
Direction Arrows
Net Sales

Growth in half year ended Sep 2025 is -20.52% vs -16.99% in Sep 2024

Direction Arrows
Consolidated Net Profit

Growth in half year ended Sep 2025 is -29.48% vs -1.85% in Sep 2024

Nine Monthly Results Snapshot (Consolidated) - Dec'25stock-summary

Dec'25
Dec'24
Change(%)
Net Sales
5,882.07
7,347.51
-19.94%
Operating Profit (PBDIT) excl Other Income
498.86
583.32
-14.48%
Interest
252.77
156.83
61.17%
Exceptional Items
0.00
0.00
Consolidate Net Profit
403.87
516.56
-21.82%
Operating Profit Margin (Excl OI)
8.48%
7.94%
0.54%
Values in Rs Cr.
Direction Arrows
Net Sales

YoY Growth in nine months ended Dec 2025 is -19.94% vs -14.90% in Dec 2024

Direction Arrows
Consolidated Net Profit

YoY Growth in nine months ended Dec 2025 is -21.82% vs -24.34% in Dec 2024

Annual Results Snapshot (Consolidated) - Mar'26stock-summary

Mar'26
Mar'25
Change(%)
Net Sales
9,071.05
10,759.58
-15.69%
Operating Profit (PBDIT) excl Other Income
765.75
844.81
-9.36%
Interest
350.11
219.13
59.77%
Exceptional Items
0.00
0.00
Consolidate Net Profit
595.47
727.41
-18.14%
Operating Profit Margin (Excl OI)
8.44%
7.85%
0.59%
Values in Rs Cr.
Direction Arrows
Net Sales

YoY Growth in year ended Mar 2026 is -15.69% vs -14.02% in Mar 2025

Direction Arrows
Consolidated Net Profit

YoY Growth in year ended Mar 2026 is -18.14% vs -21.75% in Mar 2025

stock-summaryCompany CV
About Ircon International Ltd stock-summary
stock-summary
Ircon International Ltd
Small Cap
Construction
Ircon International Limited was incorporated as a Private Company as the 'Indian Railway Construction Company Private Limited' on April 28, 1976 at Delhi. The Company became a Public Limited Company with effect from November 20, 1976 and name of the Company changed to 'Indian Railway Construction Company Limited'. Further, the name of the Company was changed to Ircon International Limited on October 17, 1995. The President of India owns 65.17% equity stake of the Company as at March 31, 2025.
Company Coordinates stock-summary
Company Details
Plot No C-4, District Centre Saket New Delhi New Delhi : 110017
stock-summary
Tel: 91-11-29565666
stock-summary
info@ircon.org
Registrar Details
Karvy Computershare Pvt Ltd., Karvy Selenium, Tower-B Plot No 31 & 32, Survey No 116/22, 115/24, 115/25, Financial District, Nanakramguda, Serilingampally, Mandal Ranga Reddy Dist, Hyderabad