
Compare IRM Energy with Similar Stocks
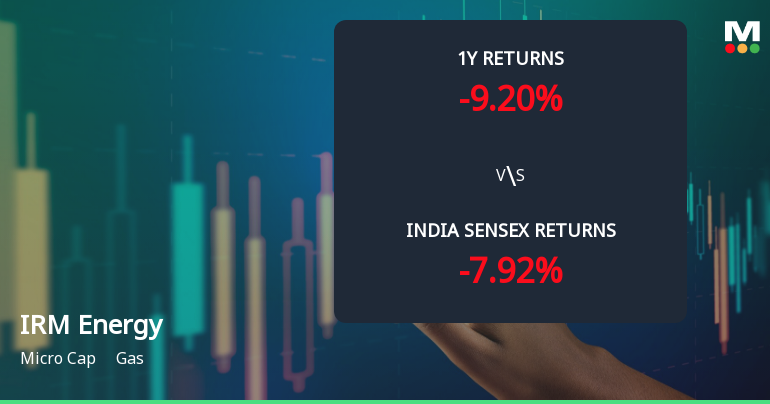
Total Returns (Price + Dividend) 
Latest dividend: 1.5 per share ex-dividend date: Sep-18-2025
Risk Adjusted Returns v/s
Returns Beta

News
IRM Energy Ltd Technical Momentum Shifts Amid Mixed Market Signals
IRM Energy Ltd, a micro-cap player in the gas sector, has experienced a notable shift in its technical momentum, moving from a sideways trend to a mildly bearish stance. This transition is underscored by a complex interplay of technical indicators, including MACD, RSI, moving averages, and others, which collectively paint a nuanced picture of the stock’s near-term prospects amid broader market pressures.
Read full news article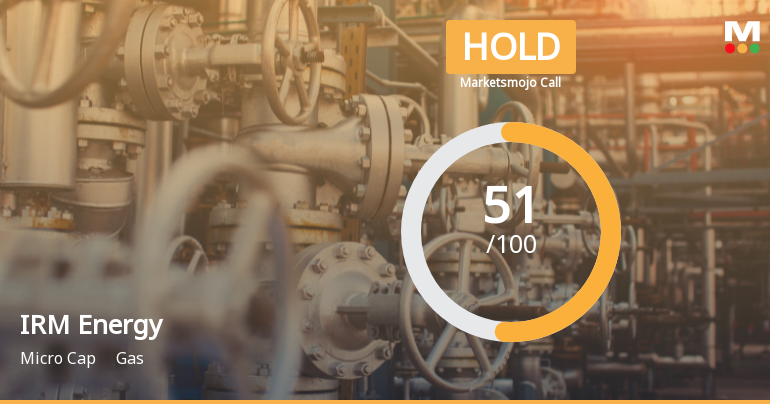
IRM Energy Ltd Upgraded to Hold as Technicals Improve Amid Mixed Financial Signals
IRM Energy Ltd has seen its investment rating upgraded from Sell to Hold, reflecting a notable improvement in its technical indicators and steady financial performance. The upgrade, effective from 2 June 2026, is driven by a combination of stabilising technical trends, positive quarterly results, and a net-debt free balance sheet, although challenges remain in long-term growth and institutional participation.
Read full news article
IRM Energy Ltd Technical Momentum Shifts Amid Mixed Market Signals
IRM Energy Ltd has exhibited a notable shift in its technical momentum, moving from a mildly bearish stance to a sideways trend, reflecting a complex interplay of bullish and bearish signals across key indicators. Despite a modest day gain of 1.81%, the stock remains under pressure over the medium term, with mixed signals from MACD, RSI, and moving averages suggesting cautious optimism for investors navigating the gas sector.
Read full news article Announcements
Compliances-Reg.24(A)-Annual Secretarial Compliance
27-May-2026 | Source : BSEPlease find attached herewith Annual Secretarial Compliance Report for the year ended March 31 2026.
Announcement under Regulation 30 (LODR)-Analyst / Investor Meet - Intimation
18-May-2026 | Source : BSEPlease find attached herewith intimation of schedule of Investors/Analysts Meeting
Announcement under Regulation 30 (LODR)-Earnings Call Transcript
14-May-2026 | Source : BSEPlease find attached herewith Transcript of earnings conference call for the quarter and year ended March 31 2026
Corporate Actions

No Upcoming Board Meetings

IRM Energy Ltd has declared 15% dividend, ex-date: 18 Sep 25

No Splits history available

No Bonus history available

No Rights history available
Quality key factors
Valuation key factors
Technicals key factors
 Technical Indicator Scale: Bearish, Mildly Bearish, Sideways, Mildly Bullish, Bullish Turned
 Shareholding Snapshot : Mar 2026
Shareholding Compare (%holding)
Promoters
None
Held by 2 Schemes (2.33%)
Held by 6 FIIs (1.59%)
Cadila Pharmaceuticals Limited (36.48%)
Enertech Distribution Management Private Limited (21.12%)
18.78%
Quarterly Results Snapshot (Consolidated) - Mar'26 - QoQ

QoQ Growth in quarter ended Mar 2026 is 5.52% vs 2.16% in Dec 2025

QoQ Growth in quarter ended Mar 2026 is -8.73% vs 11.31% in Dec 2025
Half Yearly Results Snapshot (Consolidated) - Sep'25
Growth in half year ended Sep 2025 is 14.24% vs 1.49% in Sep 2024
Growth in half year ended Sep 2025 is -13.83% vs -41.96% in Sep 2024
Nine Monthly Results Snapshot (Consolidated) - Dec'25
YoY Growth in nine months ended Dec 2025 is 11.22% vs 4.64% in Dec 2024
YoY Growth in nine months ended Dec 2025 is -0.91% vs -46.79% in Dec 2024
Annual Results Snapshot (Consolidated) - Mar'26
YoY Growth in year ended Mar 2026 is 9.35% vs 9.54% in Mar 2025
YoY Growth in year ended Mar 2026 is 17.72% vs -47.24% in Mar 2025
About IRM Energy Ltd

Company Coordinates


