
Compare Ironwood Educa with Similar Stocks
Stock DNA
Other Consumer Services
INR 70 Cr (Micro Cap)
19.00
147
0.00%
1.20
12.56%
2.34
Total Returns (Price + Dividend) 
Ironwood Educa for the last several years.
Risk Adjusted Returns v/s
Returns Beta

News

Ironwood Education Ltd Upgraded to Sell on Improved Financials and Valuation
Ironwood Education Ltd has seen its investment rating upgraded from Strong Sell to Sell as of 1 June 2026, reflecting a nuanced shift in its financial performance, valuation attractiveness, and technical outlook. Despite lingering challenges, the company’s recent quarterly results and valuation metrics have prompted a reassessment of its market stance.
Read full news article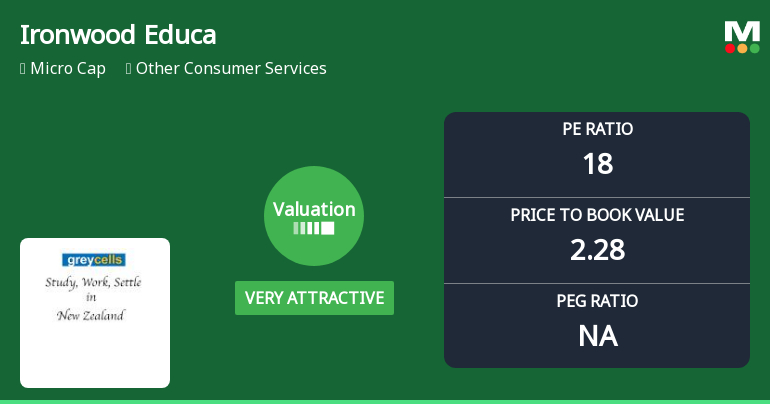
Ironwood Education Ltd Valuation Shifts to Very Attractive Amid Market Volatility
Ironwood Education Ltd has witnessed a significant shift in its valuation parameters, moving from an expensive to a very attractive rating. This change comes amid a mixed performance backdrop and evolving market dynamics within the Other Consumer Services sector, prompting investors to reassess the stock’s price attractiveness relative to its peers and historical averages.
Read full news articleAre Ironwood Education Ltd latest results good or bad?
Ironwood Education Ltd's latest financial results for Q4 FY26 present a complex picture characterized by significant revenue growth juxtaposed with sharp declines in profitability metrics. The company reported net sales of ₹22.22 crores, reflecting an extraordinary year-on-year growth of 2,238.95% from ₹0.95 crores in Q4 FY25. However, this figure represents a quarter-on-quarter decline of 24.93% from ₹29.60 crores in Q3 FY26, indicating substantial revenue volatility. In terms of profitability, the net profit for Q4 FY26 was ₹0.38 crores, which, while a positive swing from a loss of ₹8.79 crores in the same quarter last year, marked a dramatic quarter-on-quarter drop of 92.75% from ₹5.24 crores in Q3 FY26. The company's profit after tax (PAT) margin fell significantly from 17.70% in Q3 to just 1.71% in Q4, highlighting a concerning trend of margin compression despite the high revenue figures. The operati...
Read full news article Announcements
Compliances-Reg.24(A)-Annual Secretarial Compliance
30-May-2026 | Source : BSEPlease find enclosed herewith the Annual Secretarial Compliance Report for the financial year ended March 31 2026
Announcement under Regulation 30 (LODR)-Newspaper Publication
30-May-2026 | Source : BSEPursuant to Regulation 47 of SEBI (LODR) Regulations 2015 please find enclosed herewith copies of newspaper publications for the Audited Financial Results for the quarter and year ended March 31 2026
Announcement under Regulation 30 (LODR)-Award_of_Order_Receipt_of_Order
29-May-2026 | Source : BSEThe Company has been appointed as the Development Manager for the development of project situated at Kalyan
Corporate Actions

No Upcoming Board Meetings

No Dividend history available

No Splits history available

No Bonus history available

Ironwood Education Ltd has announced 61:100 rights issue, ex-date: 16 Sep 09
Quality key factors
Valuation key factors
Technicals key factors
 Technical Indicator Scale: Bearish, Mildly Bearish, Sideways, Mildly Bullish, Bullish Turned
 Shareholding Snapshot : Mar 2026
Shareholding Compare (%holding)
Promoters
None
Held by 0 Schemes
Held by 1 FIIs (0.56%)
Balaji Raghavan (19.91%)
Capri Global Holdings Private Limited (3.84%)
22.66%
Quarterly Results Snapshot (Consolidated) - Mar'26 - YoY

YoY Growth in quarter ended Mar 2026 is 2,238.95% vs -35.37% in Mar 2025
YoY Growth in quarter ended Mar 2026 is 104.32% vs -52.87% in Mar 2025
Half Yearly Results Snapshot (Consolidated) - Sep'25

Growth in half year ended Sep 2025 is -51.59% vs -12.29% in Sep 2024
Growth in half year ended Sep 2025 is -572.22% vs 200.00% in Sep 2024
Nine Monthly Results Snapshot (Consolidated) - Dec'25
YoY Growth in nine months ended Dec 2025 is 1,109.56% vs -3.46% in Dec 2024
YoY Growth in nine months ended Dec 2025 is 360.29% vs -385.71% in Dec 2024
Annual Results Snapshot (Consolidated) - Mar'26
YoY Growth in year ended Mar 2026 is 1,419.65% vs -14.99% in Mar 2025
YoY Growth in year ended Mar 2026 is 138.52% vs -68.33% in Mar 2025
About Ironwood Education Ltd

Company Coordinates


