
Compare ISGEC Heavy with Similar Stocks
Dashboard
Company has a Debt to Equity ratio (avg) of 0.31 times
Poor long term growth as Net Sales has grown by an annual rate of 4.76% and Operating profit at 7.09% over the last 5 years
With ROCE of 14.5, it has a Attractive valuation with a 2.2 Enterprise value to Capital Employed
Majority shareholders : Promoters
Underperformed the market in the last 1 year
Stock DNA
Construction
INR 6,663 Cr (Small Cap)
21.00
37
0.56%
0.19
11.17%
2.41
Total Returns (Price + Dividend) 
Latest dividend: 5 per share ex-dividend date: Sep-08-2025
Risk Adjusted Returns v/s
Returns Beta

News
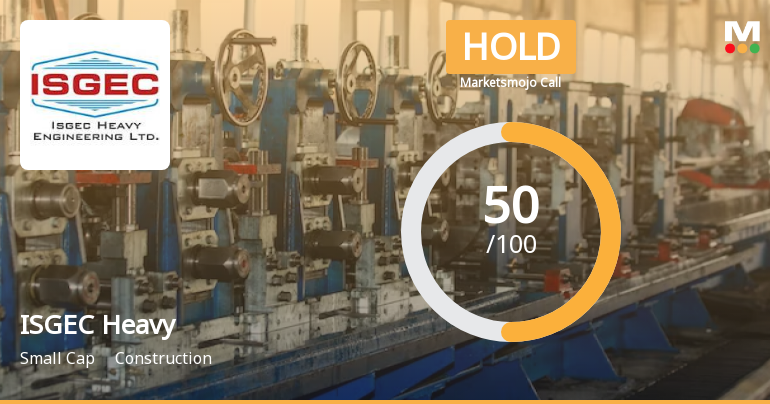
ISGEC Heavy Engineering Ltd is Rated Hold
ISGEC Heavy Engineering Ltd is rated 'Hold' by MarketsMOJO, with this rating last updated on 06 June 2026. However, the analysis and financial metrics discussed here reflect the stock's current position as of 08 June 2026, providing investors with the latest insights into its performance and outlook.
Read full news article
ISGEC Heavy Engineering Ltd Upgraded to Hold on Technical and Valuation Improvements
ISGEC Heavy Engineering Ltd has seen its investment rating upgraded from Sell to Hold as of 6 June 2026, driven primarily by a shift in technical indicators despite ongoing challenges in financial performance. The company’s Mojo Score now stands at 50.0, reflecting a more balanced outlook amid mixed signals from valuation, quality, financial trends, and technical analysis.
Read full news article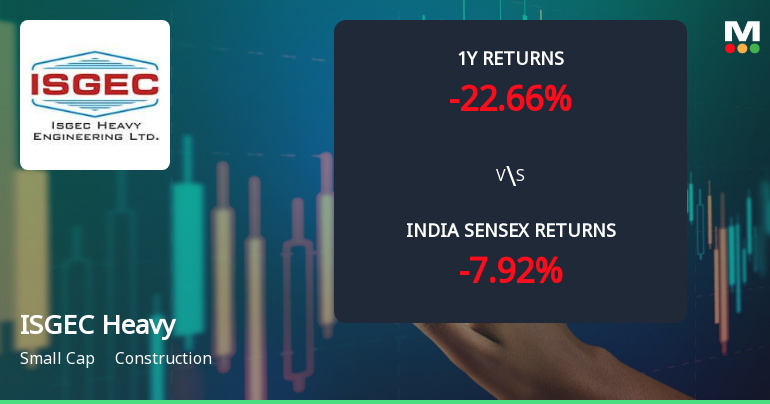
ISGEC Heavy Engineering Ltd Shows Mixed Technical Signals Amid Mild Bullish Momentum
ISGEC Heavy Engineering Ltd has recently exhibited a shift in its technical momentum, moving from a sideways trend to a mildly bullish stance. Despite a modest day gain of 1.78%, the stock’s technical indicators present a complex picture, with bullish signals on shorter timeframes contrasting with bearish cues on monthly charts. This nuanced technical landscape warrants a detailed analysis for investors seeking clarity on the stock’s near-term trajectory.
Read full news article Announcements
Announcement under Regulation 30 (LODR)-Newspaper Publication
05-Jun-2026 | Source : BSENewspapers Publication/ Advertisement
Announcement under Regulation 30 (LODR)-Earnings Call Transcript
03-Jun-2026 | Source : BSETranscript of the Conference Call/ Meet to discuss the financial performance of the Company for the quarter and year ended March 31 2026
Update On Issuance Of Guarantee - Isgec Eswatini (Proprietary) Limited Eswatini
01-Jun-2026 | Source : BSEUpdate on Issuance of Guarantee - Isgec Eswatini (Proprietary) Limited Eswatini
Corporate Actions

No Upcoming Board Meetings

ISGEC Heavy Engineering Ltd has declared 500% dividend, ex-date: 08 Sep 25

ISGEC Heavy Engineering Ltd has announced 1:10 stock split, ex-date: 28 Mar 19

No Bonus history available

No Rights history available
Quality key factors
Valuation key factors
Technicals key factors
 Technical Indicator Scale: Bearish, Mildly Bearish, Sideways, Mildly Bullish, Bullish Turned
 Shareholding Snapshot : Mar 2026
Shareholding Compare (%holding)
Promoters
None
Held by 8 Schemes (9.42%)
Held by 90 FIIs (3.85%)
The Yamuna Syndicate Ltd (45.0%)
Nippon Life India Trustee Ltd-a/c Nippon India Small Cap Fund (6.58%)
16.74%
Quarterly Results Snapshot (Consolidated) - Mar'26 - YoY

YoY Growth in quarter ended Mar 2026 is 17.42% vs -6.61% in Mar 2025

YoY Growth in quarter ended Mar 2026 is -19.71% vs 27.92% in Mar 2025
Half Yearly Results Snapshot (Consolidated) - Sep'25
Growth in half year ended Sep 2025 is -4.73% vs 11.32% in Sep 2024
Growth in half year ended Sep 2025 is -39.12% vs 43.07% in Sep 2024
Nine Monthly Results Snapshot (Consolidated) - Dec'25
YoY Growth in nine months ended Dec 2025 is 1.98% vs 7.50% in Dec 2024
YoY Growth in nine months ended Dec 2025 is -6.80% vs 3.32% in Dec 2024
Annual Results Snapshot (Consolidated) - Mar'26
YoY Growth in year ended Mar 2026 is 5.71% vs 3.26% in Mar 2025
YoY Growth in year ended Mar 2026 is -56.29% vs 2.27% in Mar 2025
About ISGEC Heavy Engineering Ltd

Company Coordinates


