
Compare IST with Similar Stocks
Dashboard
Poor Management Efficiency with a low ROE of 8.98%
- The company has been able to generate a Return on Equity (avg) of 8.98% signifying low profitability per unit of shareholders funds
Poor long term growth as Net Sales has grown by an annual rate of -1.57% and Operating profit at -6.72% over the last 5 years
Negative results in Mar 26
With ROE of 9.1, it has a Very Expensive valuation with a 0.5 Price to Book Value
Despite the size of the company, domestic mutual funds hold only 0% of the company
Below par performance in long term as well as near term
Stock DNA
Auto Components & Equipments
INR 773 Cr (Micro Cap)
5.00
36
0.00%
-0.05
9.07%
0.45
Total Returns (Price + Dividend) 
IST for the last several years.
Risk Adjusted Returns v/s
Returns Beta

News

IST Ltd Technical Momentum Shifts Amid Bearish Market Signals
IST Ltd, a micro-cap player in the Auto Components & Equipments sector, has experienced a notable shift in its technical momentum, reflecting a deteriorating outlook. The company’s recent downgrade from a 'Sell' to a 'Strong Sell' rating by MarketsMOJO on 27 Oct 2025 underscores growing concerns, as key technical indicators signal bearish trends across multiple timeframes. This article analyses the evolving price momentum, technical indicator signals, and the implications for investors amid a challenging market environment.
Read full news article
IST Ltd is Rated Sell by MarketsMOJO
IST Ltd is rated 'Sell' by MarketsMOJO, with this rating last updated on 12 Feb 2026. However, the analysis and financial metrics discussed here reflect the stock's current position as of 04 June 2026, providing investors with an up-to-date view of the company’s fundamentals, valuation, financial trends, and technical outlook.
Read full news article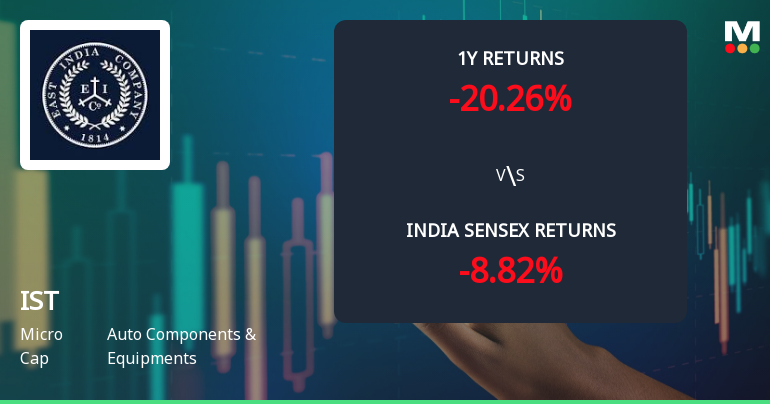
IST Ltd Technical Momentum Shifts Amid Bearish Sentiment
IST Ltd, a micro-cap player in the Auto Components & Equipments sector, has experienced a notable shift in its technical momentum, reflecting a deteriorating price trend and bearish signals across multiple indicators. The stock’s recent downgrade from a Strong Sell to a Sell rating by MarketsMOJO, coupled with a 5.3% decline in a single day, underscores mounting investor caution amid broader market pressures.
Read full news article Announcements
Compliances-Reg.24(A)-Annual Secretarial Compliance
30-May-2026 | Source : BSEIn compliance with Regulation 24A of the Listing Regulations (LODR) we are enclosing herewith the Annual Secretarial Compliance Report for the financial year ended 31st March 2026.
Announcement under Regulation 30 (LODR)-Newspaper Publication
30-May-2026 | Source : BSEPFA the Newspaper publication w.r.t. the abstract of audited financial results of the Company duly approved by the Board of directors on 29th May 2026. The abstract were publised by the Company in Financial Express(English) and Hari Bhoomi (Hindi) newspapers on 30th May 2026
Audited Financial Results For The Quarter And Financial Year Ended 31St March 2026
29-May-2026 | Source : BSEPursuant to Regulation 33 of Listing Regulations (LODR) Please find enclosed herewith the Audited Financial Results for the Financial Year ended 31st March 2026 as approved by the Board of Directors of the Company at its meeting held on 29th May 2026 which concluded at 4.15 p.m.
Corporate Actions

No Upcoming Board Meetings

No Dividend history available

IST Ltd has announced 5:10 stock split, ex-date: 01 Nov 19

No Bonus history available

No Rights history available
Quality key factors
Valuation key factors
Technicals key factors
 Technical Indicator Scale: Bearish, Mildly Bearish, Sideways, Mildly Bullish, Bullish Turned
 Shareholding Snapshot : Mar 2026
Shareholding Compare (%holding)
Promoters
None
Held by 0 Schemes
Held by 0 FIIs
Gupta International Investment Co. Limited (49.95%)
Saubhagya Realty And Trade Llp (4.95%)
12.72%
Quarterly Results Snapshot (Consolidated) - Mar'26 - QoQ

QoQ Growth in quarter ended Mar 2026 is 2.26% vs 17.32% in Dec 2025
QoQ Growth in quarter ended Mar 2026 is -115.32% vs 116.63% in Dec 2025
Half Yearly Results Snapshot (Consolidated) - Sep'25
Growth in half year ended Sep 2025 is -2.32% vs 13.13% in Sep 2024
Growth in half year ended Sep 2025 is 1.11% vs 44.43% in Sep 2024
Nine Monthly Results Snapshot (Consolidated) - Dec'25
YoY Growth in nine months ended Dec 2025 is 5.68% vs 7.57% in Dec 2024

YoY Growth in nine months ended Dec 2025 is 32.34% vs 21.46% in Dec 2024
Annual Results Snapshot (Consolidated) - Mar'26
YoY Growth in year ended Mar 2026 is 9.68% vs 4.90% in Mar 2025
YoY Growth in year ended Mar 2026 is 9.70% vs 11.04% in Mar 2025
About IST Ltd

Company Coordinates


