
Dashboard
Strong ability to service debt as the company has a low Debt to EBITDA ratio of 0.66 times
Healthy long term growth as Net Sales has grown by an annual rate of 31.52% and Operating profit at 57.01%
Flat results in Sep 25
With ROCE of 31.7, it has a Expensive valuation with a 6.1 Enterprise value to Capital Employed
Falling Participation by Institutional Investors
Stock DNA
Construction
INR 13,642 Cr (Small Cap)
31.00
38
0.25%
0.11
21.77%
6.63
Total Returns (Price + Dividend) 
Latest dividend: 2 per share ex-dividend date: Jul-31-2025
Risk Adjusted Returns v/s
Returns Beta

News

Cemindia Project Sees Revision in Market Evaluation Amid Mixed Financial Signals
Cemindia Project, a small-cap player in the construction sector, has experienced a revision in its market evaluation reflecting a nuanced shift in its financial and technical outlook. This adjustment follows a detailed reassessment of the company’s quality, valuation, financial trends, and technical indicators, set against a backdrop of recent stock performance and sector dynamics.
Read More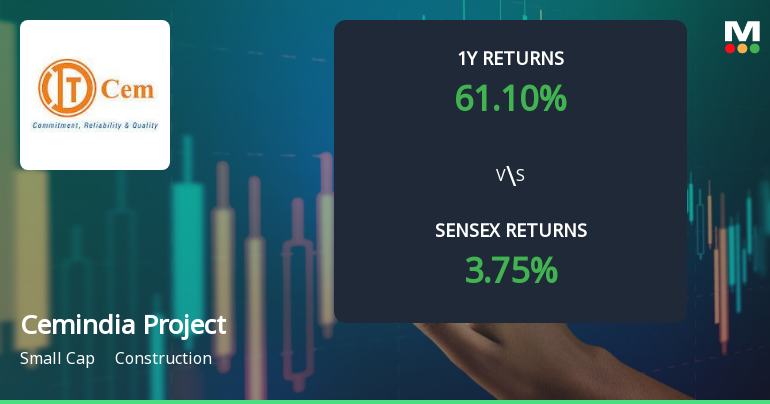
Cemindia Projects Technical Momentum Shifts Amid Mixed Market Signals
Cemindia Projects, a key player in the construction sector, has experienced a nuanced shift in its technical momentum, reflecting a complex interplay of bullish and bearish signals across multiple timeframes. Recent market data reveals a transition from a predominantly bullish stance to a more mildly bullish outlook, underscored by mixed readings from key technical indicators such as MACD, RSI, and moving averages.
Read More
Cemindia Projects Technical Momentum Shifts Amid Construction Sector Dynamics
Cemindia Projects has exhibited a notable shift in its technical momentum, reflecting evolving market dynamics within the construction sector. Recent price movements and technical indicators suggest a transition towards a more bullish stance, supported by key metrics such as moving averages and Bollinger Bands, while some oscillators present a mixed picture. This article analyses the latest technical signals and price performance to provide a comprehensive view of Cemindia Projects’ current market positioning.
Read More Announcements
Announcement under Regulation 30 (LODR)-Newspaper Publication
26-Nov-2025 | Source : BSELetter enclosed
Announcement under Regulation 30 (LODR)-Change in Management
05-Nov-2025 | Source : BSELetter enclosed
Board Meeting Outcome for Outcome Of Board Meeting
05-Nov-2025 | Source : BSEOutcome of Board meeting
Corporate Actions

No Upcoming Board Meetings

Cemindia Projects Ltd has declared 200% dividend, ex-date: 31 Jul 25

Cemindia Projects Ltd has announced 1:10 stock split, ex-date: 21 Aug 15

No Bonus history available

Cemindia Projects Ltd has announced 1:1 rights issue, ex-date: 30 Oct 07
Quality key factors
Valuation key factors
Technicals key factors
 Technical Indicator Scale: Bearish, Mildly Bearish, Sideways, Mildly Bullish, Bullish Turned
 Shareholding Snapshot : Sep 2025
Shareholding Compare (%holding)
Promoters
None
Held by 7 Schemes (0.27%)
Held by 166 FIIs (8.36%)
Renew Exim Dmcc (67.46%)
Hitesh Ramji Javeri (1.78%)
18.19%
Quarterly Results Snapshot (Consolidated) - Sep'25 - QoQ

QoQ Growth in quarter ended Sep 2025 is -14.43% vs 2.53% in Jun 2025
QoQ Growth in quarter ended Sep 2025 is -21.54% vs 20.85% in Jun 2025
Half Yearly Results Snapshot (Consolidated) - Sep'25
Growth in half year ended Sep 2025 is 7.90% vs 26.99% in Sep 2024
Growth in half year ended Sep 2025 is 42.18% vs 62.74% in Sep 2024
Nine Monthly Results Snapshot (Consolidated) - Dec'24
YoY Growth in nine months ended Dec 2024 is 21.19% vs 57.83% in Dec 2023
YoY Growth in nine months ended Dec 2024 is 40.73% vs 113.39% in Dec 2023
Annual Results Snapshot (Consolidated) - Mar'25
YoY Growth in year ended Mar 2025 is 17.87% vs 51.60% in Mar 2024
YoY Growth in year ended Mar 2025 is 36.19% vs 120.32% in Mar 2024
About Cemindia Projects Ltd

Company Coordinates


