
Compare Ivalue Infosolut with Similar Stocks
Stock DNA
Computers - Software & Consulting
INR 1,573 Cr (Micro Cap)
15.00
20
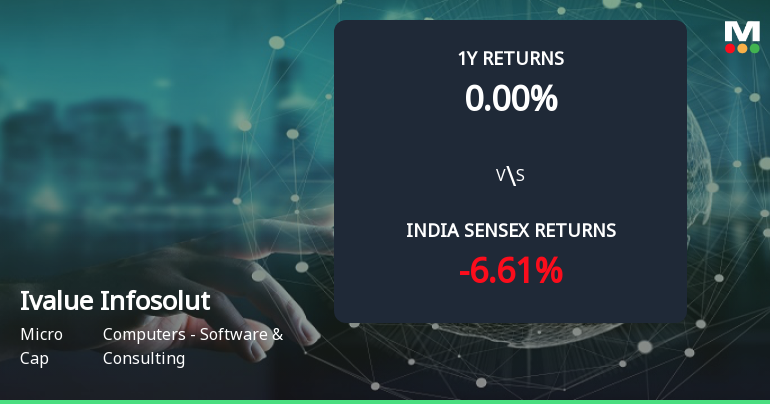
0.00%
-0.12
19.28%
3.15
Total Returns (Price + Dividend) 
Ivalue Infosolut for the last several years.
Risk Adjusted Returns v/s
Returns Beta

News
Ivalue Infosolutions Ltd Forms Golden Cross Amid Mixed Technical Signals
The 50-day moving average has crossed above the 200-day moving average for Ivalue Infosolutions Ltd, signalling a golden cross on 22 Jul 2026. Yet, the stock declined 2.01% on the day the cross formed, and monthly technical indicators remain inconclusive. This divergence between the moving averages and other signals calls for a detailed examination of the cross's reliability.
Read full news article
Ivalue Infosolutions Ltd is Rated Buy by MarketsMOJO
Ivalue Infosolutions Ltd is rated Buy by MarketsMOJO, with this rating last updated on 06 July 2026. However, all fundamentals, returns, and financial metrics discussed here reflect the company’s current position as of 13 July 2026, providing investors with the most up-to-date analysis.
Read full news article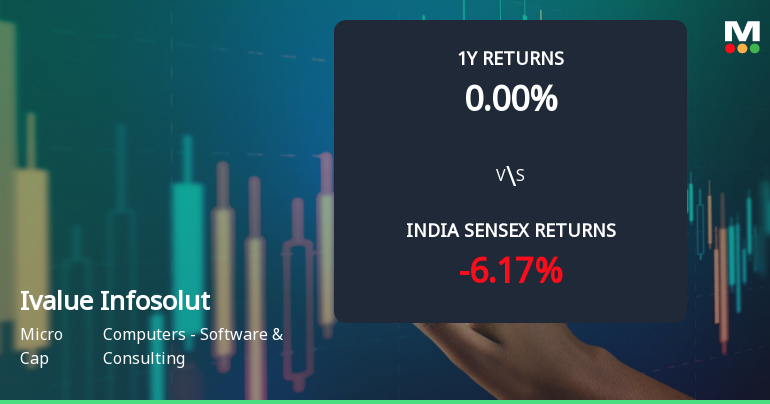
Ivalue Infosolutions Ltd Sees Technical Momentum Shift Amid Bullish Signals
Ivalue Infosolutions Ltd, a micro-cap player in the Computers - Software & Consulting sector, has demonstrated a notable shift in its technical momentum, upgrading its MarketsMOJO grade from Hold to Buy on 6 July 2026. This upgrade reflects a positive change in price action and technical indicators, signalling a potential bullish phase for the stock amid a broader sideways to mildly bullish trend.
Read full news article Announcements
Compliances-Certificate under Reg. 74 (5) of SEBI (DP) Regulations 2018
20-Jul-2026 | Source : BSECompliance Certificate pursuant to Regulation 74 (5) of SEBI (Depositories and Participants) Regulations 2018 for the quarter ended June 30 2026
Announcement under Regulation 30 (LODR)-Change in Management
14-Jul-2026 | Source : BSEIntimation under Regulation 30 of SEBI (Listing Obligation & Disclosure Requirements) Regulations 2015 - Reappointment / Change in Board of Directors and Senior Management Personnel (SMP)
Pursuant To Regulation 29(2) Of SEBI (SAST) Regulation 2011 The Company Has Received A Disclosure From Its Shareholder On 1St July 2026 Regarding Disposal/Sale Of Equity Shares From The Open Market On 30Th June 2026.
01-Jul-2026 | Source : BSEThis is to inform you that pursuant to Regulation 29(2) of SEBI (SAST) Regulations 2011 the Company has received a disclosure from its shareholder (Sundara (Mauritius) Limited) on 1st July 2026 regarding disposal/sale of equity shares of 5698416 in the open market on 30th June 2026.
Corporate Actions

No Upcoming Board Meetings

No Dividend history available

No Splits history available

No Bonus history available

No Rights history available
Quality key factors
Valuation key factors
Technicals key factors
 Technical Indicator Scale: Bearish, Mildly Bearish, Sideways, Mildly Bullish, Bullish Turned
 Shareholding Snapshot : Mar 2026
Shareholding Compare (%holding)
Non Institution
None
Held by 2 Schemes (6.87%)
Held by 15 FIIs (2.22%)
Sunil Kumar Pillai (13.9%)
Sundara (mauritius) Limited (10.43%)
34.33%
Quarterly Results Snapshot (Standalone) - Mar'26 - QoQ

QoQ Growth in quarter ended Mar 2026 is 21.01% vs -33.24% in Dec 2025
QoQ Growth in quarter ended Mar 2026 is 173.23% vs -45.59% in Dec 2025
Half Yearly Results Snapshot (Standalone) - Sep'25
Not Applicable: The company has declared_date for only one period
Not Applicable: The company has declared_date for only one period
Nine Monthly Results Snapshot (Standalone) - Dec'25
Not Applicable: The company has declared_date for only one period
Not Applicable: The company has declared_date for only one period
Annual Results Snapshot (Consolidated) - Mar'26

YoY Growth in year ended Mar 2026 is 14.40% vs 18.26% in Mar 2025
YoY Growth in year ended Mar 2026 is 14.78% vs 20.48% in Mar 2025
About Ivalue Infosolutions Ltd

Company Coordinates


