
Compare J B Chemicals & with Similar Stocks
Dashboard
High Management Efficiency with a high ROE of 19.25%
Company has a Debt to Equity ratio (avg) of 0.02 times
Poor long term growth as Operating profit has grown by an annual rate 13.47% of over the last 5 years
Negative results in Mar 26
With ROE of 17.5, it has a Very Expensive valuation with a 8.1 Price to Book Value
High Institutional Holdings at 37.72%
Market Beating performance in long term as well as near term
Stock DNA
Pharmaceuticals & Biotechnology
INR 33,964 Cr (Small Cap)
46.00
34
0.92%
-0.15
18.88%
8.99
Total Returns (Price + Dividend) 
Latest dividend: 12.7 per share ex-dividend date: Feb-11-2026
Risk Adjusted Returns v/s
Returns Beta

News
Are J B Chemicals & Pharmaceuticals Ltd latest results good or bad?
J B Chemicals & Pharmaceuticals Ltd's latest financial results for Q4 FY26 reveal significant challenges, particularly in terms of profitability and sales performance. The company reported a net profit of ₹101.37 crore, which reflects a notable sequential decline of 48.77% from the previous quarter and a year-on-year decrease of 30.42%. This sharp drop in profit raises concerns about the sustainability of the company's earnings. Net sales for the same quarter amounted to ₹904.23 crore, marking a sequential decline of 15.07% from ₹1,064.72 crore in Q3 FY26 and a year-on-year decrease of 4.77%. This decline in revenue indicates potential cyclical and structural challenges within the business, as it represents the lowest quarterly revenue in FY26. The operating profit margin, excluding other income, contracted to 22.24%, down from 27.78% in the previous quarter, indicating significant margin compression. Thi...
Read full news article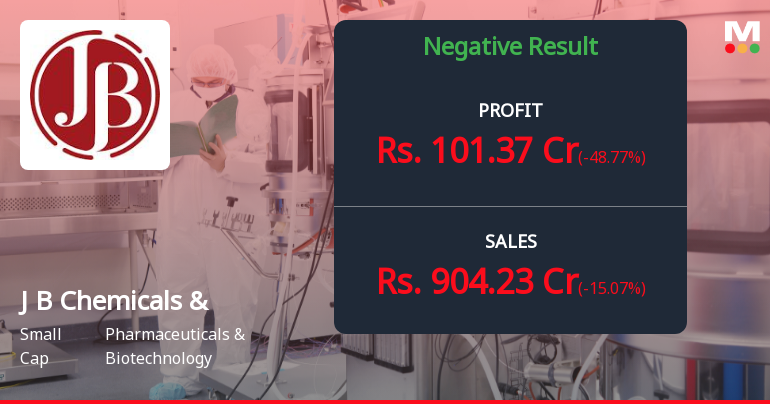
J B Chemicals Q4 FY26: Sharp Profit Decline Amid Margin Pressure Raises Concerns
J B Chemicals & Pharmaceuticals Ltd. reported a concerning Q4 FY26 performance, with net profit plunging 48.77% quarter-on-quarter to ₹101.37 crores and declining 30.42% year-on-year. The sharp contraction in profitability, coupled with sequential revenue decline of 15.07% to ₹904.23 crores, has raised red flags about the company's operational momentum. Following the results announcement, shares traded at ₹2,133.80 on May 12, 2026, down 3.35% from the previous close, reflecting investor disappointment with the pharmaceutical manufacturer's performance.
Read full news article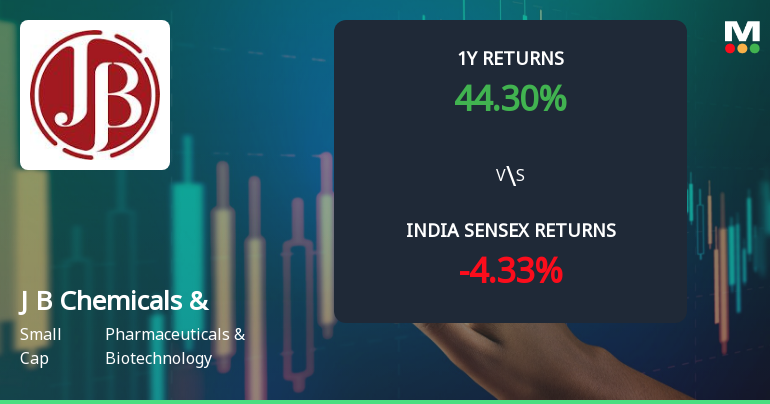
J B Chemicals & Pharmaceuticals Ltd Technical Momentum Shifts to Bullish Amid Strong Price Gains
J B Chemicals & Pharmaceuticals Ltd has demonstrated a notable shift in price momentum, supported by a series of bullish technical indicators. The stock’s recent performance, coupled with upgrades in its technical trend and a revised Mojo Grade, signals renewed investor interest amid a challenging market backdrop.
Read full news article Announcements
JB Chemicals & Pharmaceuticals Limited - Updates
28-Nov-2019 | Source : NSEJB Chemicals & Pharmaceuticals Limited has informed the Exchange regarding 'Approval for re-classification of certain promoter group members to public'.
JB Chemicals & Pharmaceuticals Limited - Other General Purpose
21-Nov-2019 | Source : NSEJB Chemicals & Pharmaceuticals Limited has informed the Exchange regarding Related Party Transaction disclosure under Regulation 23(9) of the SEBI (Listing Obligations and Disclosure Requirements) Regulations, 2015.
JB Chemicals & Pharmaceuticals Limited - Public Announcement-Buyback of Shares
14-Nov-2019 | Source : NSEJB Chemicals & Pharmaceuticals Limited has submitted to the Exchange a copy of Public Announcement - Buyback of Shares.
Corporate Actions

No Upcoming Board Meetings

J B Chemicals & Pharmaceuticals Ltd has declared 1270% dividend, ex-date: 11 Feb 26

J B Chemicals & Pharmaceuticals Ltd has announced 1:2 stock split, ex-date: 18 Sep 23

No Bonus history available

No Rights history available
Quality key factors
Valuation key factors
Technicals key factors
 Technical Indicator Scale: Bearish, Mildly Bearish, Sideways, Mildly Bullish, Bullish Turned
 Shareholding Snapshot : Mar 2026
Shareholding Compare (%holding)
Promoters
None
Held by 36 Schemes (19.0%)
Held by 215 FIIs (16.33%)
Torrent Pharmaceuticals Limited (48.8%)
Kotak Midcap Fund (4.4%)
11.77%
Quarterly Results Snapshot (Consolidated) - Mar'26 - QoQ

QoQ Growth in quarter ended Mar 2026 is -15.07% vs -1.86% in Dec 2025
QoQ Growth in quarter ended Mar 2026 is -48.77% vs -4.78% in Dec 2025
Half Yearly Results Snapshot (Consolidated) - Sep'25
Growth in half year ended Sep 2025 is 8.67% vs 12.77% in Sep 2024
Growth in half year ended Sep 2025 is 16.73% vs 19.97% in Sep 2024
Nine Monthly Results Snapshot (Consolidated) - Dec'25
YoY Growth in nine months ended Dec 2025 is 9.27% vs 13.20% in Dec 2024
YoY Growth in nine months ended Dec 2025 is 18.33% vs 20.50% in Dec 2024
Annual Results Snapshot (Consolidated) - Mar'26
YoY Growth in year ended Mar 2026 is 5.87% vs 12.45% in Mar 2025
YoY Growth in year ended Mar 2026 is 7.56% vs 19.35% in Mar 2025
About J B Chemicals & Pharmaceuticals Ltd

Company Coordinates


