
Compare J K Cements with Similar Stocks
Dashboard
Poor long term growth as Operating profit has grown by an annual rate 6.91% of over the last 5 years
Flat results in Mar 26
With ROCE of 13.5, it has a Expensive valuation with a 3.7 Enterprise value to Capital Employed
Underperformed the market in the last 1 year
Stock DNA
Cement & Cement Products
INR 41,594 Cr (Mid Cap)
41.00
33
0.28%
0.81
14.54%
5.87
Total Returns (Price + Dividend) 
Latest dividend: 15 per share ex-dividend date: Jul-08-2025
Risk Adjusted Returns v/s
Returns Beta

News
J K Cements Ltd is Rated Sell
J K Cements Ltd is rated Sell by MarketsMOJO, with this rating last updated on 23 February 2026. However, the analysis and financial metrics discussed here reflect the stock’s current position as of 06 July 2026, providing investors with the latest insights into the company’s performance and outlook.
Read full news article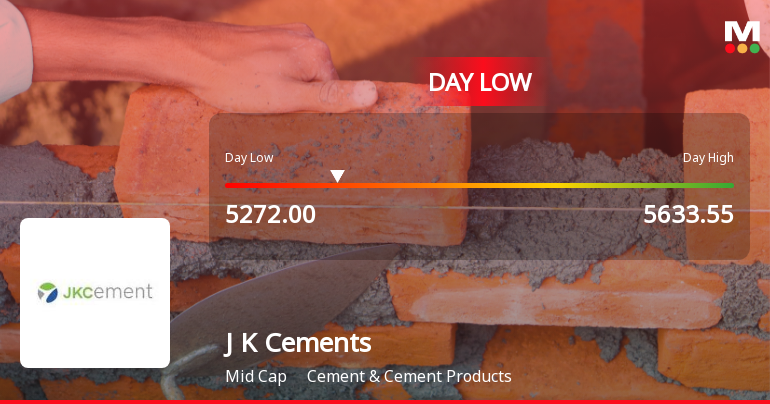
J K Cements Ltd Hits Intraday Low Amid Price Pressure on 29 Jun 2026
Shares of J K Cements Ltd declined sharply on 29 Jun 2026, hitting an intraday low of Rs 5,272, reflecting a 5.45% drop from the previous close. The stock underperformed its sector and broader market indices amid prevailing negative sentiment and price pressures.
Read full news article
J K Cements Ltd is Rated Sell by MarketsMOJO
J K Cements Ltd is rated 'Sell' by MarketsMOJO, with this rating last updated on 23 February 2026. However, the analysis and financial metrics discussed here reflect the stock's current position as of 25 June 2026, providing investors with an up-to-date view of the company’s fundamentals, returns, and market standing.
Read full news article Announcements
JK Cement Limited - Updates
05-Dec-2019 | Source : NSEJK Cement Limited has informed the Exchange regarding 'Monthly Demat For The Month Of November 2019'.
JK Cement Limited - Disclosure under SEBI Takeover Regulations
03-Dec-2019 | Source : NSEJK Cement Limited has submitted to the Exchange a copy of disclosure under Regulation 10(6) in respect of acquisition under Regulation 10 of SEBI (Substantial Acquisition of Shares & Takeovers) Regulations, 2011.
JK Cement Limited - Clarification
26-Nov-2019 | Source : NSEJK Cement Limited with respect to announcement dated 09-Nov-2019, regarding Appointment of Mr Sudhir Jalan as Non- Executive Director of the company w.e.f. November 09, 2019. On basis of above the Company is required to clarify following: 1. Date of appointment (as applicable) & term of appointment
Corporate Actions

No Upcoming Board Meetings

J K Cements Ltd has declared 200% dividend, ex-date: 10 Jul 26

No Splits history available

No Bonus history available

No Rights history available
Quality key factors
Valuation key factors
Technicals key factors
 Technical Indicator Scale: Bearish, Mildly Bearish, Sideways, Mildly Bullish, Bullish Turned
 Shareholding Snapshot : Mar 2026
Shareholding Compare (%holding)
Promoters
None
Held by 41 Schemes (21.61%)
Held by 228 FIIs (16.86%)
Yadu International Pvt Limited (40.19%)
Kavita Yadupati Singhania (5.01%)
11.83%
Quarterly Results Snapshot (Consolidated) - Mar'26 - YoY

YoY Growth in quarter ended Mar 2026 is 8.55% vs 15.31% in Mar 2025
YoY Growth in quarter ended Mar 2026 is -7.62% vs 63.99% in Mar 2025
Half Yearly Results Snapshot (Consolidated) - Sep'25

Growth in half year ended Sep 2025 is 18.71% vs -2.68% in Sep 2024
Growth in half year ended Sep 2025 is 55.86% vs 6.27% in Sep 2024
Nine Monthly Results Snapshot (Consolidated) - Dec'25
YoY Growth in nine months ended Dec 2025 is 18.52% vs -1.80% in Dec 2024
YoY Growth in nine months ended Dec 2025 is 31.72% vs -13.15% in Dec 2024
Annual Results Snapshot (Consolidated) - Mar'26
YoY Growth in year ended Mar 2026 is 15.52% vs 2.80% in Mar 2025
YoY Growth in year ended Mar 2026 is 15.26% vs 8.89% in Mar 2025
About J K Cements Ltd

Company Coordinates


