
Compare Jagjanani Text. with Similar Stocks
Dashboard
With a Negative Book Value, the company has a Weak Long Term Fundamental Strength
- Poor long term growth as Net Sales has grown by an annual rate of 2.30% and Operating profit at 0% over the last 5 years
- The company has a negative book value of Rs 0.06 crore
Flat results in Mar 26
Risky - Negative EBITDA
Underperformed the market in the last 1 year
Stock DNA
Garments & Apparels
INR 8 Cr (Micro Cap)
NA (Loss Making)
25
0.00%
0.00
32.00%
-7.74
Total Returns (Price + Dividend) 
Jagjanani Text. for the last several years.
Risk Adjusted Returns v/s
Returns Beta

News
Are Jagjanani Textiles Ltd latest results good or bad?
Jagjanani Textiles Ltd's latest financial results indicate a concerning state of operations. For the quarter ending March 2026, the company reported net sales of ₹0.00 crores, consistent with the previous quarters, reflecting a complete absence of operational revenue. The net profit for the quarter was a loss of ₹0.04 crores, which aligns with the ongoing trend of negative profitability, as the company has not generated any sales for seven consecutive quarters. The financial performance highlights a significant operational void, with the manufacturing facility remaining inactive throughout the fiscal year. This lack of revenue generation raises serious questions about the company's viability and management's strategy moving forward. The operating losses before depreciation, interest, and tax were recorded at ₹0.05 crores, driven by minimal administrative expenses, further emphasizing the company's non-oper...
Read full news article
Jagjanani Textiles Q4 FY26: Zero Revenue Streak Continues as Losses Mount
Jagjanani Textiles Ltd., the Jaipur-based cotton yarn manufacturer, reported yet another quarter of zero revenue in Q4 FY26, extending an operational shutdown that has persisted for at least seven consecutive quarters. The company recorded a net loss of ₹0.04 crores for the March 2026 quarter, whilst shareholders witnessed their equity value evaporate to a negative book value of ₹0.04 per share. With a microscopic market capitalisation of just ₹6.86 crores, the stock plunged 12.87% on May 22 to ₹4.40, reflecting deepening investor despair over the company's complete absence of business activity.
Read full news article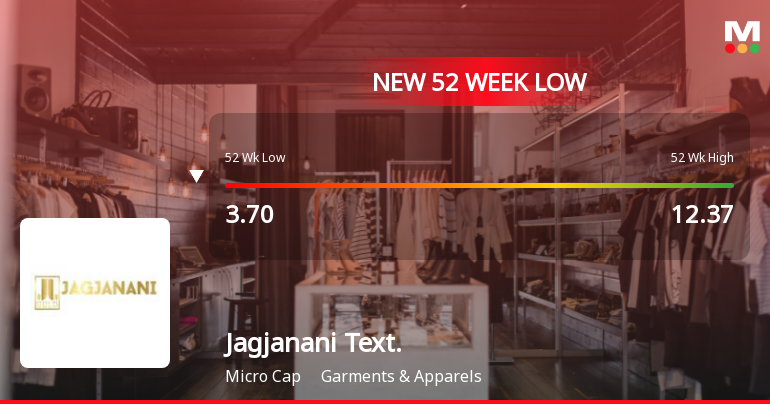
Jagjanani Textiles Ltd Falls to 52-Week Low of Rs 3.2 as Sell-Off Deepens
For the second consecutive session, Jagjanani Textiles Ltd has seen its share price slide sharply, hitting a fresh 52-week low of Rs 3.2 on 24 Mar 2026. This decline comes amid broader market weakness, but the stock’s underperformance is stark, having lost nearly 22% over the past two days and underperforming its sector by over 18% today alone.
Read full news article Announcements
Board Meeting Outcome for Outcome Of Board Meeting Pursuant To Regulation 30 And 33 Of SEBI (Listing Obligations And Disclosure Requirements) Regulations 2015 As Amended (SEBI Listing Regulations).
21-May-2026 | Source : BSEPursuant to Regulations 30 33 and other applicable regulations of SEBI (Listing Obligations and Disclosure Requirements) Regulations 2015 we hereby inform that the Board of Directors of JAGJANANI TEXTILES LIMITED [the Company] at its meeting held today i.e. Thursday 21st May 2026 has inter-alia discussed approved and taken on record the following matter: 1. Approved Audited Financial Results of the Company for the Quarter and Year ended on 31st March 2026 and; 2. Took on record Auditors Report thereon issued by Statutory Auditors of the Company M/s. Rajeshkumar P. Shah & Co Chartered Accountants (FRN: 129110W).
Results - Financial Results For FY 31/03/2026.
21-May-2026 | Source : BSEFinancial results for the Quarter and Year ended on 31/03/2026.
Board Meeting Intimation for Consideration & Approval Of Audited Financial Results For The Fourth Quarter And Year Ended On 31St March 2026.
18-May-2026 | Source : BSEJagjanani Textiles Ltdhas informed BSE that the meeting of the Board of Directors of the Company is scheduled on 21/05/2026 inter alia to consider and approve 1. Audited Financial Results (Standalone) of the Company for the Fourth Quarter and Year ended on 31st March 2026 and to take on record the Report of the Statutory Auditors thereon.
Corporate Actions

No Upcoming Board Meetings

No Dividend history available

No Splits history available

No Bonus history available

No Rights history available
Quality key factors
Valuation key factors
Technicals key factors
 Technical Indicator Scale: Bearish, Mildly Bearish, Sideways, Mildly Bullish, Bullish Turned
 Shareholding Snapshot : Mar 2026
Shareholding Compare (%holding)
Non Institution
None
Held by 0 Schemes
Held by 0 FIIs
Avnish Manojkumar Patel (16.75%)
S. K. Singhal (17.01%)
70.76%
Quarterly Results Snapshot (Standalone) - Mar'26 - QoQ
QoQ Growth in quarter ended Mar 2026 is 0.00% vs 0.00% in Dec 2025

QoQ Growth in quarter ended Mar 2026 is 81.82% vs -633.33% in Dec 2025
Half Yearly Results Snapshot (Standalone) - Sep'25
Growth in half year ended Sep 2025 is 0.00% vs -100.00% in Sep 2024

Growth in half year ended Sep 2025 is -500.00% vs -100.26% in Sep 2024
Nine Monthly Results Snapshot (Standalone) - Dec'25
YoY Growth in nine months ended Dec 2025 is 0.00% vs -100.00% in Dec 2024
YoY Growth in nine months ended Dec 2025 is -180.00% vs -102.59% in Dec 2024
Annual Results Snapshot (Standalone) - Mar'26
YoY Growth in year ended Mar 2026 is 0.00% vs 0.00% in Mar 2025
YoY Growth in year ended Mar 2026 is -128.57% vs -103.65% in Mar 2025
About Jagjanani Textiles Ltd

Company Coordinates


