Jagran Prakashan

  • Market Cap: Micro Cap
  • Industry: Media & Entertainment
  • ISIN: INE199G01027
  • NSEID: JAGRAN
  • BSEID: 532705
INR
62.05
0.05 (0.08%)
BSENSE

Sep 11, 03:30 PM

BSE+NSE Vol: 1.55 lacs

  • Price Points
  • Score
  • Mojo Parameters
  • Total Return
  • News and Corporate Actions
  • Key factors
  • Shareholding
  • Financials
  • CompanyCV
stock-summaryPrice Point
High/Low

1Day

52 Week

Valuation
Technical
Day's Volume

CASH

1.55 lacs (-35.67%) Volume

Shareholding (Jun 2026)

FII

2.30%

Held by 59 FIIs

DII

4.29%

Held by 7 DIIs

Promoter

69.00%

Which are the latest news on Jagran Prakashan?

12-Sep-2026

Why is Jagran Prakashan Ltd falling/rising?

06-Sep-2026

As of 05-Sep, Jagran Prakashan Ltd's stock price is Rs 60.97, down 0.46%, and has underperformed the Sensex with a year-to-date decline of 14.63%. The stock is trading below its moving averages and is near its 52-week low, indicating bearish trends despite a high dividend yield of 16.34%.

As of 05-Sep, Jagran Prakashan Ltd's stock price is falling, currently at Rs 60.97, which reflects a change of -0.28 (-0.46%). The stock has underperformed compared to the benchmark Sensex, which has seen a decline of -0.97% over the past week. Additionally, the stock has experienced a significant drop of -14.63% year-to-date, compared to a -10.21% decline in the Sensex during the same period.<BR><BR>The stock is also trading lower than its moving averages across various time frames, including the 5-day, 20-day, 50-day, 100-day, and 200-day averages, indicating a bearish trend. Furthermore, there has been a notable decrease in investor participation, with delivery volume falling by -31.39% against the 5-day average, suggesting reduced interest among investors.<BR><BR>Jagran Prakashan Ltd is currently close to its 52-week low, being only 3.23% away from Rs 59.1. Despite a high dividend yield of 16.34%, which is a positive factor, the overall performance metrics indicate that the stock is facing downward pressure.

View full answer

Who are in the management team of Jagran Prakashan?

01-Sep-2026

The management team of Jagran Prakashan includes key members such as Mahendra Mohan Gupta (Chairman & Managing Director), Dhirendra Mohan Gupta, and Sanjay Gupta (both Whole Time Executive Directors), along with several other executive and independent directors, bringing diverse expertise to the company.

The management team of Jagran Prakashan includes the following key members:<BR><BR>1. **Mahendra Mohan Gupta** - Chairman & Managing Director (CMD) & Executive Director<BR>2. **Dhirendra Mohan Gupta** - Whole Time Executive Director<BR>3. **Sanjay Gupta** - Whole Time Executive Director<BR>4. **Shailesh Gupta** - Non-Independent Executive Director<BR>5. **Sunil Gupta** - Non-Independent Executive Director<BR>6. **Sandeep Gupta** - Non-Independent Executive Director<BR>7. **Satish Chandra Mishra** - Non-Independent Executive Director<BR>8. **Devendra Mohan Gupta** - Non-Executive & Non-Independent Director<BR>9. **Shailendra Mohan Gupta** - Non-Executive & Non-Independent Director<BR>10. **Anuj Puri** - Independent Non-Executive Director<BR>11. **Dilip Cherian** - Independent Non-Executive Director<BR>12. **Divya Rupchand Karani** - Independent Non-Executive Director<BR>13. **Jayant Davar** - Independent Non-Executive Director<BR>14. **Ravi Sardana** - Independent Non-Executive Director<BR>15. **Shailendra Swarup** - Independent Non-Executive Director<BR>16. **Shashidhar Sinha** - Independent Non-Executive Director<BR>17. **Vijay Tandon** - Independent Non-Executive Director<BR>18. **Vikram Sakhuja** - Independent Non-Executive Director<BR><BR>This diverse team brings a wealth of experience and expertise to the company.

View full answer

What does Jagran Prakashan do?

01-Sep-2026

Jagran Prakashan Ltd is a micro-cap publishing company in the Media & Entertainment industry, known for its significant presence in print media. As of June 2026, it reported net sales of ₹499 Cr and a net profit of ₹59 Cr, with a market cap of ₹1,343 Cr.

Overview:<BR>Jagran Prakashan Ltd is a publisher company operating in the Media & Entertainment industry and is categorized as a Micro Cap.<BR><BR>History:<BR>Jagran Prakashan Ltd was incorporated in July 1975 as a Private Limited Company and was later renamed from Jagran Prakashan Private Limited to Jagran Prakashan Limited on April 1, 1989. The most recent quarterly results reported net sales and net profit for June 2026.<BR><BR>Financial Snapshot:<BR>Net Sales: 499 Cr (Quarterly Results - Jun 2026) <BR>Net Profit: 59 Cr (Quarterly Results - Jun 2026) <BR>Market Cap: INR 1,343 Cr (Micro Cap)<BR><BR>Key Metrics:<BR>P/E: 7.00 <BR>Industry P/E: 12 <BR>Dividend Yield: 16.30% <BR>Debt-Equity: -0.38 <BR>Return on Equity: 9.77% <BR>Price to Book: 0.66 <BR><BR>Contact Details:<BR>Address: Jagran Building, 2 Sarvodaya Nagar Kanpur Uttar Pradesh : 208005 <BR>Tel: 91-512-2216161 <BR>Email: investor@jagran.com <BR>Website: http://www.jplcorp.in

View full answer

Who are the peers of the Jagran Prakashan?

01-Sep-2026

Peers of Jagran Prakashan include Netwrk.18 Media, D B Corp, Hathway Cable, Media Matrix, Signpost India, Den Networks, JOJO, Panorama Studios, and Balaji Telefilms. JOJO leads in growth and returns, while Jagran Prakashan has average management risk and capital structure, with a 1-year return of -14.91%.

Peers: The peers of Jagran Prakashan are Netwrk.18 Media, D B Corp, Hathway Cable, Media Matrix, Signpost India, Den Networks, JOJO, Panorama Studios, and Balaji Telefilms.<BR><BR>Quality Snapshot: Excellent management risk is observed at D B Corp and Den Networks, while Average management risk is found at Jagran Prakashan, Signpost India, Panorama Studios, and Balaji Telefilms, and the rest have Below Average management risk. For Growth, JOJO stands out with Excellent growth, while Average growth is seen at Panorama Studios and Signpost India, and the rest have Below Average growth. In terms of Capital Structure, D B Corp and Den Networks exhibit Excellent capital structure, while Jagran Prakashan also has Excellent capital structure, Average is seen at Media Matrix, Good at JOJO and Signpost India, and the rest have Below Average capital structure.<BR><BR>Return Snapshot: JOJO has the highest 1-year return at 69.27%, while Netwrk.18 Media has the lowest at -48.44%, with Jagran Prakashan's 1-year return at -14.91% being significantly better than Netwrk.18 Media but worse than JOJO. Additionally, the six-month returns are negative for Netwrk.18 Media, D B Corp, Hathway Cable, Media Matrix, Panorama Studios, and Balaji Telefilms.

View full answer

How big is Jagran Prakashan?

01-Sep-2026

As of 31st August, Jagran Prakashan Ltd has a market capitalization of 1,343.00 Cr, with recent Net Sales of 1,915.52 Cr and a Net Profit of 188.57 Cr.

As of 31st August, Jagran Prakashan Ltd has a market capitalization of 1,343.00 Cr, categorizing it as a Micro Cap company.<BR><BR>In the latest four quarters, the company reported Net Sales of 1,915.52 Cr and a Net Profit of 188.57 Cr.<BR><BR>The latest annual period for the balance sheet is March 2026, with Shareholder's Funds amounting to 2,015.53 Cr and Total Assets of 2,686.80 Cr.

View full answer

Should I buy, sell or hold Jagran Prakashan Ltd?

14-Aug-2026

When is the next results date for Jagran Prakashan Ltd?

04-Aug-2026

Jagran Prakashan Ltd will announce its results on 12 August 2026.

Jagran Prakashan Ltd is scheduled to declare its results on 12 August 2026.

View full answer

Are Jagran Prakashan Ltd latest results good or bad?

30-May-2026

Jagran Prakashan Ltd's latest results are concerning, with a 68.63% decline in net profit to ₹16.98 crore and a decrease in revenue to ₹472.10 crore. The operating margin fell to 10.13%, reflecting ongoing challenges in the print media sector.

The latest results for Jagran Prakashan Ltd indicate a concerning performance. In Q4 FY26, the company reported a net profit of ₹16.98 crore, which represents a significant decline of 68.63% compared to the previous quarter. Revenue also fell to ₹472.10 crore, down 1.85% year-on-year and marking a second consecutive quarter of sequential decline.<BR><BR>The operating margin has sharply decreased to 10.13%, down from 14.98% in the previous quarter, reflecting ongoing challenges in the print media sector as advertising budgets continue to shift towards digital platforms. Additionally, the company faced an extraordinary tax charge, resulting in an effective tax rate of 81.22%, which severely impacted profitability.<BR><BR>Overall, these results highlight a deterioration in financial performance, with significant pressures on both revenue and margins, raising concerns about the company's ability to navigate the evolving media landscape effectively.

View full answer

How has been the historical performance of Jagran Prakashan?

17-Nov-2025

Jagran Prakashan's historical performance shows a decline in net sales, operating profit, and net profit from March 2024 to March 2025, indicating challenges in growth and profitability. Total liabilities and assets also decreased during this period, alongside a reduction in cash flow from operating activities.

Answer:<BR>The historical performance of Jagran Prakashan shows a fluctuating trend in its financial metrics over the years.<BR><BR>Breakdown:<BR>Jagran Prakashan's net sales saw a decline from INR 1,933.91 crore in March 2024 to INR 1,888.13 crore in March 2025, following a previous increase from INR 1,856.17 crore in March 2023. The total operating income also decreased to INR 1,888.13 crore in March 2025 from INR 1,933.91 crore in March 2024. The company's operating profit (PBDIT) fell significantly to INR 265.60 crore in March 2025 from INR 361.37 crore in the prior year, reflecting a declining operating profit margin of 8.49%. Profit before tax also decreased to INR 136.32 crore in March 2025 from INR 222.42 crore in March 2024, leading to a profit after tax of INR 93.64 crore, down from INR 164.46 crore. The consolidated net profit followed a similar trend, dropping to INR 130.93 crore in March 2025 from INR 183.74 crore in March 2024. On the balance sheet, total liabilities decreased to INR 2,702.35 crore in March 2025 from INR 2,826.83 crore in March 2024, while total assets also declined to INR 2,702.35 crore from INR 2,826.83 crore. Cash flow from operating activities decreased to INR 223 crore in March 2025 from INR 296 crore in March 2024, contributing to a net cash outflow of INR 11 crore in March 2025. Overall, the financial performance of Jagran Prakashan indicates challenges in maintaining growth and profitability in recent years.

View full answer

Is Jagran Prakashan overvalued or undervalued?

11-Nov-2025

As of November 10, 2025, Jagran Prakashan is considered very attractive and undervalued with a PE ratio of 8.84, a Price to Book Value of 0.08, and a Dividend Yield of 8.55%, significantly lower than its peers, despite recent underperformance compared to the Sensex.

As of 10 November 2025, the valuation grade for Jagran Prakashan has moved from attractive to very attractive, indicating a significant improvement in its perceived value. The company is currently considered undervalued, supported by a PE ratio of 8.84, a Price to Book Value of 0.08, and a Dividend Yield of 8.55%. These ratios suggest that the stock is trading at a substantial discount relative to its earnings and book value.<BR><BR>In comparison to its peers, Jagran Prakashan's PE ratio is notably lower than D B Corp's 13.41 and MPS's 24.81, which are classified as attractive and very expensive, respectively. Additionally, the company's PEG ratio stands at 0.00, indicating no growth expectations priced in, further reinforcing its undervaluation status. Despite recent underperformance relative to the Sensex over the past year, where Jagran Prakashan returned -18.49% compared to the Sensex's 5.09%, the current valuation metrics suggest a compelling opportunity for investors.

View full answer

Is Jagran Prakashan technically bullish or bearish?

11-Nov-2025

As of November 10, 2025, Jagran Prakashan's technical trend is mildly bearish, indicated by mixed signals from MACD, RSI, moving averages, and other indicators.

As of 10 November 2025, the technical trend has changed from bearish to mildly bearish. The current technical stance for Jagran Prakashan is mildly bearish. Key indicators driving this stance include the MACD on a weekly basis showing mildly bullish momentum, while the monthly MACD remains bearish. The RSI is bullish on a monthly basis but shows no signal on the weekly timeframe. Moving averages are bearish on the daily chart, and both KST and Dow Theory indicate a mildly bearish outlook on the weekly and monthly timeframes. Overall, despite some mixed signals, the prevailing trend leans towards a mildly bearish position.

View full answer

Who are the top shareholders of the Jagran Prakashan?

17-Jul-2025

The top shareholders of Jagran Prakashan include Jagran Media Network Investment Private Limited with 67.97%, mutual funds with 7.57%, HDFC Trustee Company Limited at 7.23%, Foreign Institutional Investors at 2.7%, and individual investors holding 16.11%. There are no pledged promoter holdings reported.

The top shareholders of Jagran Prakashan include the promoters, with Jagran Media Network Investment Private Limited holding the largest share at 67.97%. Additionally, mutual funds collectively hold 7.57% through three schemes, while HDFC Trustee Company Limited is the highest public shareholder with 7.23%. Foreign Institutional Investors (FIIs) own 2.7% of the company, and individual investors account for 16.11% of the shares. There are no pledged promoter holdings reported.

View full answer

What is the bonus history of the Jagran Prakashan?

06-Jun-2025

Jagran Prakashan's most recent bonus issue occurred on November 2, 2006, with a ratio of 1:5, meaning shareholders received one additional share for every five shares held. The record date for this bonus was November 3, 2006.

Jagran Prakashan has a bonus history that includes a notable issue on November 2, 2006. During this event, the company announced a bonus in the ratio of 1:5, meaning that for every five shares held, shareholders received one additional share. The record date for this bonus was November 3, 2006. This was the most recent bonus issue recorded for the company. If you have any more questions about Jagran Prakashan or its financial activities, feel free to ask!

View full answer

Has Jagran Prakashan declared dividend?

06-Jun-2025

Yes, Jagran Prakashan Ltd has declared a 300% dividend, amounting to ₹6 per share, with an ex-date of May 30, 2025. While recent short-term returns have been negative, longer-term returns over 3 to 5 years show positive growth.

Jagran Prakashan Ltd has declared a 300% dividend.<BR><BR>Dividend Details:<BR>- Percentage announced: 300%<BR>- Amount per share: 6 per share<BR>- Ex-date: May 30, 2025<BR><BR>Dividend Yield: 14.93%.<BR><BR>Total Returns by Period:<BR>In the last 6 months, the price return was -17.79%, the dividend return was 6.67%, resulting in a total return of -11.12%.<BR><BR>Over the past year, the price return was -15.88%, the dividend return was 12.02%, leading to a total return of -3.86%.<BR><BR>In the 2-year period, the price return was -0.72%, the dividend return was 14.07%, culminating in a total return of 13.35%.<BR><BR>For the 3-year period, the price return was 27.78%, the dividend return was 31.28%, which resulted in a total return of 59.06%.<BR><BR>In the last 4 years, the price return was 19.41%, the dividend return was 23.70%, giving a total return of 43.11%.<BR><BR>Over the past 5 years, the price return was 74.4%, the dividend return was 36.50%, resulting in a total return of 110.9%.<BR><BR>Overall, Jagran Prakashan has declared a significant dividend, and while the short-term returns have been negative, the longer-term returns show a positive trend, particularly over the 3 to 5-year periods.

View full answer
iScoreScore
Click here to find our call on this stock
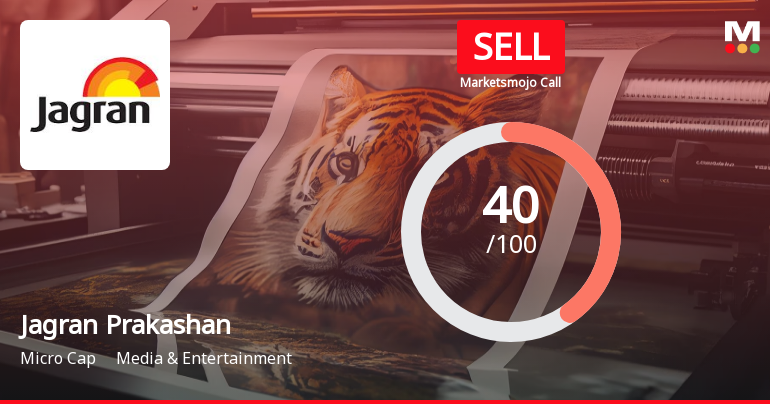
Strong Sell
Sell
Hold
Buy
Strong Buy

Dashboard

1

Poor long term growth as Net Sales has grown by an annual rate of 6.96% and Operating profit at 3.94% over the last 5 years

 
2

Flat results in Jun 26

3

Falling Participation by Institutional Investors

4

Consistent Underperformance against the benchmark over the last 3 years

stock-summaryMojo Parameters

Mojo Parameters

Loading Valuation Snapshot...

Stock DNA

stock-summary
Industry

Media & Entertainment

stock-summary
Market cap

INR 1,348 Cr (Micro Cap)

stock-summary
P/E

7.00

stock-summary
Industry P/E

11

stock-summary
Dividend Yield

16.13%

stock-summary
Debt Equity

-0.38

stock-summary
Return on Equity

9.77%

stock-summary
Price to Book

0.67

Revenue and Profits:
Net Sales:
499 Cr
(Quarterly Results - Jun 2026)
Net Profit:
59 Cr
stock-summaryTotal Returns
Total Returns (Price + Dividend) stock-summary
Dividend Yield (16.13%)
TimePeriod
Price Return
Dividend Return
Total Return
3 Months
0.85%
0%
0.85%
6 Months
-2.19%
4.89%
2.7%
1 Year
-13.6%
4.15%
-9.45%
2 Years
-41.1%
9.65%
-31.45%
3 Years
-40.68%
14.00%
-26.68%
4 Years
-3.2%
22.08%
18.88%
5 Years
7.82%
29.44%
37.26%

Latest dividend: 3 per share ex-dividend date: Jun-05-2026

Risk Adjusted Returns v/s stock-summary
Returns Beta
Icon
Beta has not been calculated since enough price history is not available
stock-summaryNews & Corporate Actions

Announcements stock-summary

Announcement Under Regulation 30 Of The SEBI (Listing Obligations And Disclosure Requirements) Regulations 2015.

03-Sep-2026 | Source : BSE

Disclosure made by the Company Under Regulation 30 of the SEBI (Listing Obligations and Disclosure Requirements) Regulations 2015.

Announcement Under Regulation 30 Of The SEBI (Listing Obligations And Disclosure Requirements) Regulations 2015.

27-Aug-2026 | Source : BSE

Disclosure made by the Company Under Regulation 30 of the SEBI (Listing Obligations and Disclosure Requirements) Regulations 2015.

Newspaper Publication Intimation To The Stock Exchange.

22-Aug-2026 | Source : BSE

Jagran Prakashan Limited has informed the Stock Exchange about the Newspaper Publication.

Corporate Actions stock-summary

stock-summary
BOARD MEETING

No Upcoming Board Meetings

stock-summary
DIVIDEND

Jagran Prakashan Ltd has declared 350% dividend, ex-date: 05 Jun 26

stock-summary
SPLITS

Jagran Prakashan Ltd has announced 2:10 stock split, ex-date: 09 Jan 08

stock-summary
BONUS

Jagran Prakashan Ltd has announced 1:5 bonus issue, ex-date: 02 Nov 06

stock-summary
RIGHTS

No Rights history available

stock-summaryKey Factors

Quality key factors stock-summary

Factor
Value
Sales Growth (5y)
6.96%
EBIT Growth (5y)
3.94%
EBIT to Interest (avg)
6.30
Debt to EBITDA (avg)
1.02
Net Debt to Equity (avg)
-0.38
Sales to Capital Employed (avg)
0.82
Tax Ratio
30.40%
Dividend Payout Ratio
99.74%
Pledged Shares
0
Institutional Holding
6.59%
ROCE (avg)
9.40%
ROE (avg)
9.19%

Valuation key factors

Factor
Value
P/E Ratio
7
Industry P/E
11
Price to Book Value
0.67
EV to EBIT
3.42
EV to EBITDA
2.30
EV to Capital Employed
0.47
EV to Sales
0.31
PEG Ratio
0.36
Dividend Yield
16.05%
ROCE (Latest)
13.13%
ROE (Latest)
9.77%

Technicals key factors

Indicator
Weekly
Monthly
MACD
Bearish
Bearish
RSI
No Signal
No Signal
Bollinger Bands
Mildly Bearish
Mildly Bearish
Moving Averages
Bearish (Daily)
KST
Bearish
Mildly Bullish
Dow Theory
Mildly Bearish
Mildly Bearish
OBV
Mildly Bearish
Mildly Bearish
stock-summary Technical Indicator Scale: Bearish, Mildly Bearish, Sideways, Mildly Bullish, Bullish  Turned 
stock-summaryShareholding
Shareholding Snapshot : Jun 2026stock-summary
Shareholding Compare (%holding) stock-summary
Majority shareholders

Promoters

Pledged Promoter Holdings

None

Mutual Funds

Held by 2 Schemes (4.23%)

FIIs

Held by 59 FIIs (2.3%)

Promoter with highest holding

Jagran Media Network Investment Private Limited (67.97%)

Highest Public shareholder

Hdfc Trustee Company Limited (3.89%)

Individual Investors Holdings

19.51%

stock-summaryFinancial
[
  {
    "link": "quarterly",
    "btn_text": "All Quarterly Results",
    "header": "Quarterly Results Snapshot (Consolidated) - Jun'26 - YoY",
    "rhs": [
      {
        "prefix": "Net Sales ",
        "suffix": "YoY Growth in quarter ended Jun 2026 is 8.54% vs 3.59% in Jun 2025",
        "dir": 1
      },
      {
        "prefix": "Consolidated Net Profit ",
        "suffix": "YoY Growth in quarter ended Jun 2026 is -12.49% vs 63.32% in Jun 2025",
        "dir": -1
      }
    ],
    "table": {
      "header": [
        "Jun'26",
        "Jun'25",
        "Change(%)"
      ],
      "body": [
        {
          "field": "Net Sales",
          "val1": "499.35",
          "val2": "460.05",
          "chgp": "8.54%",
          "chgp_class": "positive"
        },
        {
          "field": "Operating Profit (PBDIT) excl Other Income",
          "val1": "70.03",
          "val2": "63.79",
          "chgp": "9.78%",
          "chgp_class": "positive"
        },
        {
          "field": "Interest",
          "val1": "3.33",
          "val2": "5.40",
          "chgp": "-38.33%",
          "chgp_class": "positive"
        },
        {
          "field": "Exceptional Items",
          "val1": "0.00",
          "val2": "0.00",
          "chgp": "",
          "chgp_class": "neutral"
        },
        {
          "field": "Consolidate Net Profit",
          "val1": "58.84",
          "val2": "67.24",
          "chgp": "-12.49%",
          "chgp_class": "negative"
        },
        {
          "field": "Operating Profit Margin (Excl OI)",
          "val1": "14.02%",
          "val2": "13.87%",
          "chgp": "0.15%",
          "chgp_class": "positive"
        }
      ]
    }
  },
  {
    "link": "half-yearly",
    "btn_text": "All Half Yearly Results",
    "header": "Half Yearly Results Snapshot (Consolidated) - Sep'25",
    "rhs": [
      {
        "prefix": "Net Sales ",
        "suffix": " Growth in half year ended Sep 2025 is 4.13% vs -2.48% in Sep 2024",
        "dir": 1
      },
      {
        "prefix": "Consolidated Net Profit ",
        "suffix": " Growth in half year ended Sep 2025 is 49.60% vs -3.34% in Sep 2024",
        "dir": 1
      }
    ],
    "table": {
      "header": [
        "Sep'25",
        "Sep'24",
        "Change(%)"
      ],
      "body": [
        {
          "field": "Net Sales",
          "val1": "927.41",
          "val2": "890.63",
          "chgp": "4.13%",
          "chgp_class": "positive"
        },
        {
          "field": "Operating Profit (PBDIT) excl Other Income",
          "val1": "130.37",
          "val2": "133.05",
          "chgp": "-2.01%",
          "chgp_class": "negative"
        },
        {
          "field": "Interest",
          "val1": "10.89",
          "val2": "10.83",
          "chgp": "0.55%",
          "chgp_class": "negative"
        },
        {
          "field": "Exceptional Items",
          "val1": "0.00",
          "val2": "0.00",
          "chgp": "",
          "chgp_class": "neutral"
        },
        {
          "field": "Consolidate Net Profit",
          "val1": "125.87",
          "val2": "84.14",
          "chgp": "49.60%",
          "chgp_class": "positive"
        },
        {
          "field": "Operating Profit Margin (Excl OI)",
          "val1": "14.06%",
          "val2": "14.94%",
          "chgp": "-0.88%",
          "chgp_class": "negative"
        }
      ]
    }
  },
  {
    "link": "nine-monthly",
    "btn_text": "All Nine Monthly Results",
    "header": "Nine Monthly Results Snapshot (Consolidated) - Dec'25",
    "rhs": [
      {
        "prefix": "Net Sales ",
        "suffix": "YoY Growth in nine months ended Dec 2025 is -0.21% vs -1.20% in Dec 2024",
        "dir": 1
      },
      {
        "prefix": "Consolidated Net Profit ",
        "suffix": "YoY Growth in nine months ended Dec 2025 is 22.67% vs -8.78% in Dec 2024",
        "dir": 1
      }
    ],
    "table": {
      "header": [
        "Dec'25",
        "Dec'24",
        "Change(%)"
      ],
      "body": [
        {
          "field": "Net Sales",
          "val1": "1,404.12",
          "val2": "1,407.13",
          "chgp": "-0.21%",
          "chgp_class": "negative"
        },
        {
          "field": "Operating Profit (PBDIT) excl Other Income",
          "val1": "201.80",
          "val2": "226.51",
          "chgp": "-10.91%",
          "chgp_class": "negative"
        },
        {
          "field": "Interest",
          "val1": "16.39",
          "val2": "16.09",
          "chgp": "1.86%",
          "chgp_class": "negative"
        },
        {
          "field": "Exceptional Items",
          "val1": "0.00",
          "val2": "0.00",
          "chgp": "",
          "chgp_class": "neutral"
        },
        {
          "field": "Consolidate Net Profit",
          "val1": "179.99",
          "val2": "146.73",
          "chgp": "22.67%",
          "chgp_class": "positive"
        },
        {
          "field": "Operating Profit Margin (Excl OI)",
          "val1": "14.37%",
          "val2": "16.10%",
          "chgp": "-1.73%",
          "chgp_class": "negative"
        }
      ]
    }
  },
  {
    "link": "annual",
    "btn_text": "All Annual Results",
    "header": "Annual Results Snapshot (Consolidated) - Mar'26",
    "rhs": [
      {
        "prefix": "Net Sales ",
        "suffix": "YoY Growth in year ended Mar 2026 is -0.63% vs -2.37% in Mar 2025",
        "dir": 1
      },
      {
        "prefix": "Consolidated Net Profit ",
        "suffix": "YoY Growth in year ended Mar 2026 is 50.44% vs -28.74% in Mar 2025",
        "dir": 1
      }
    ],
    "table": {
      "header": [
        "Mar'26",
        "Mar'25",
        "Change(%)"
      ],
      "body": [
        {
          "field": "Net Sales",
          "val1": "1,876.22",
          "val2": "1,888.13",
          "chgp": "-0.63%",
          "chgp_class": "negative"
        },
        {
          "field": "Operating Profit (PBDIT) excl Other Income",
          "val1": "249.63",
          "val2": "160.28",
          "chgp": "55.75%",
          "chgp_class": "positive"
        },
        {
          "field": "Interest",
          "val1": "20.32",
          "val2": "21.45",
          "chgp": "-5.27%",
          "chgp_class": "positive"
        },
        {
          "field": "Exceptional Items",
          "val1": "0.00",
          "val2": "0.00",
          "chgp": "",
          "chgp_class": "neutral"
        },
        {
          "field": "Consolidate Net Profit",
          "val1": "196.97",
          "val2": "130.93",
          "chgp": "50.44%",
          "chgp_class": "positive"
        },
        {
          "field": "Operating Profit Margin (Excl OI)",
          "val1": "13.30%",
          "val2": "8.49%",
          "chgp": "4.81%",
          "chgp_class": "positive"
        }
      ]
    }
  }
]

Quarterly Results Snapshot (Consolidated) - Jun'26 - YoYstock-summary

Jun'26
Jun'25
Change(%)
Net Sales
499.35
460.05
8.54%
Operating Profit (PBDIT) excl Other Income
70.03
63.79
9.78%
Interest
3.33
5.40
-38.33%
Exceptional Items
0.00
0.00
Consolidate Net Profit
58.84
67.24
-12.49%
Operating Profit Margin (Excl OI)
14.02%
13.87%
0.15%
Values in Rs Cr.
Direction Arrows
Net Sales

YoY Growth in quarter ended Jun 2026 is 8.54% vs 3.59% in Jun 2025

Direction Arrows
Consolidated Net Profit

YoY Growth in quarter ended Jun 2026 is -12.49% vs 63.32% in Jun 2025

Half Yearly Results Snapshot (Consolidated) - Sep'25stock-summary

Sep'25
Sep'24
Change(%)
Net Sales
927.41
890.63
4.13%
Operating Profit (PBDIT) excl Other Income
130.37
133.05
-2.01%
Interest
10.89
10.83
0.55%
Exceptional Items
0.00
0.00
Consolidate Net Profit
125.87
84.14
49.60%
Operating Profit Margin (Excl OI)
14.06%
14.94%
-0.88%
Values in Rs Cr.
Direction Arrows
Net Sales

Growth in half year ended Sep 2025 is 4.13% vs -2.48% in Sep 2024

Direction Arrows
Consolidated Net Profit

Growth in half year ended Sep 2025 is 49.60% vs -3.34% in Sep 2024

Nine Monthly Results Snapshot (Consolidated) - Dec'25stock-summary

Dec'25
Dec'24
Change(%)
Net Sales
1,404.12
1,407.13
-0.21%
Operating Profit (PBDIT) excl Other Income
201.80
226.51
-10.91%
Interest
16.39
16.09
1.86%
Exceptional Items
0.00
0.00
Consolidate Net Profit
179.99
146.73
22.67%
Operating Profit Margin (Excl OI)
14.37%
16.10%
-1.73%
Values in Rs Cr.
Direction Arrows
Net Sales

YoY Growth in nine months ended Dec 2025 is -0.21% vs -1.20% in Dec 2024

Direction Arrows
Consolidated Net Profit

YoY Growth in nine months ended Dec 2025 is 22.67% vs -8.78% in Dec 2024

Annual Results Snapshot (Consolidated) - Mar'26stock-summary

Mar'26
Mar'25
Change(%)
Net Sales
1,876.22
1,888.13
-0.63%
Operating Profit (PBDIT) excl Other Income
249.63
160.28
55.75%
Interest
20.32
21.45
-5.27%
Exceptional Items
0.00
0.00
Consolidate Net Profit
196.97
130.93
50.44%
Operating Profit Margin (Excl OI)
13.30%
8.49%
4.81%
Values in Rs Cr.
Direction Arrows
Net Sales

YoY Growth in year ended Mar 2026 is -0.63% vs -2.37% in Mar 2025

Direction Arrows
Consolidated Net Profit

YoY Growth in year ended Mar 2026 is 50.44% vs -28.74% in Mar 2025

stock-summaryCompany CV
About Jagran Prakashan Ltd stock-summary
stock-summary
Jagran Prakashan Ltd
Micro Cap
Media & Entertainment
Jagran Prakashan Limited (JPL), a publisher company was established in July, 1975 as a Private Limited Company as Jagran Prakashan Private Limited. The name of the Company was changed from Jagran Prakashan Private Limited to Jagran Prakashan Limited with effect from 1st April, 1989. JPL's birth was the pet project of the Indian freedom fighter Late Shri Puran Chandra Gupta.
Company Coordinates stock-summary
Company Details
Jagran Building, 2 Sarvodaya Nagar Kanpur Uttar Pradesh : 208005
stock-summary
Tel: 91-512-2216161
stock-summary
investor@jagran.com
Registrar Details
Karvy Computershare Pvt Ltd, Plot No 17-24 , Near Image Hospital,, Reliance Cybervilae,Vithalrao Nagar,, Madhapur, Hyderabad