
Compare Jai Balaji Inds. with Similar Stocks
Stock DNA
Ferrous Metals
INR 5,611 Cr (Small Cap)
18.00
24
0.00%
0.18
13.18%
2.52
Total Returns (Price + Dividend) 
Latest dividend: 0.08000000000000002 per share ex-dividend date: Sep-15-2011
Risk Adjusted Returns v/s
Returns Beta

News

Jai Balaji Industries Ltd is Rated Strong Sell
Jai Balaji Industries Ltd is rated Strong Sell by MarketsMOJO, with this rating last updated on 15 June 2026. However, the analysis and financial metrics presented here reflect the company’s current position as of 30 July 2026, providing investors with the latest insights into its performance and outlook.
Read full news article
Jai Balaji Industries Ltd is Rated Strong Sell
Jai Balaji Industries Ltd is rated Strong Sell by MarketsMOJO, with this rating last updated on 15 June 2026. However, the analysis and financial metrics discussed here reflect the stock's current position as of 19 July 2026, providing investors with the latest insights into the company’s performance and outlook.
Read full news article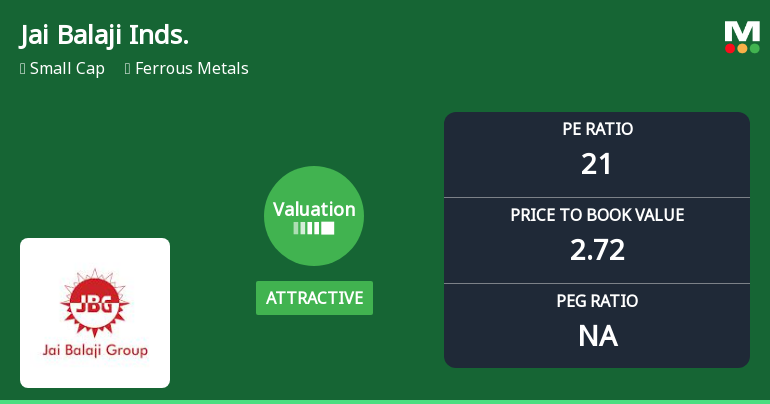
Jai Balaji Industries Ltd Valuation Shifts Signal Attractive Entry Amid Sector Volatility
Jai Balaji Industries Ltd has seen a notable shift in its valuation parameters, moving from a fair to an attractive rating, despite a challenging sector backdrop and a recent downgrade in its overall mojo grade to Strong Sell. This article analyses the company’s current price-to-earnings and price-to-book value ratios in comparison to its peers and historical averages, providing investors with a comprehensive view of its price attractiveness and potential investment implications.
Read full news article Announcements
Disclosure Under Regulation 30 Of Securities And Exchange Board Of India (Listing Obligations And Disclosure Requirements) Regulations 2015
01-Jul-2026 | Source : BSEDisclosure under Regulation 30 of Securities and Exchange Board of India (Listing Obligations and Disclosure Requirements) Regulations 2015
Closure of Trading Window
22-Jun-2026 | Source : BSEClosure of Trading Window
Announcement under Regulation 30 (LODR)-Analyst / Investor Meet - Intimation
16-Jun-2026 | Source : BSEIntimation of Analyst/ Institutional Investors Meet under Regulation 30 of SEBI (LODR) Regulations 2015.
Corporate Actions

No Upcoming Board Meetings

Jai Balaji Industries Ltd has declared 4% dividend, ex-date: 15 Sep 11

Jai Balaji Industries Ltd has announced 2:10 stock split, ex-date: 17 Jan 25

No Bonus history available

No Rights history available
Quality key factors
Valuation key factors
Technicals key factors
 Technical Indicator Scale: Bearish, Mildly Bearish, Sideways, Mildly Bullish, Bullish Turned
 Shareholding Snapshot : Jun 2026
Shareholding Compare (%holding)
Promoters
31.0913
Held by 5 Schemes (0.08%)
Held by 37 FIIs (2.78%)
Hariaksh Industries Private Limited (17.54%)
Mahananda Securities Ltd. (4.97%)
10.34%
Quarterly Results Snapshot (Standalone) - Mar'26 - YoY

YoY Growth in quarter ended Mar 2026 is 9.79% vs -13.87% in Mar 2025
YoY Growth in quarter ended Mar 2026 is -71.69% vs -72.35% in Mar 2025
Half Yearly Results Snapshot (Consolidated) - Sep'25

Growth in half year ended Sep 2025 is -17.23% vs 8.11% in Sep 2024
Growth in half year ended Sep 2025 is -73.19% vs -2.69% in Sep 2024
Nine Monthly Results Snapshot (Standalone) - Dec'25
YoY Growth in nine months ended Dec 2025 is -15.17% vs 4.23% in Dec 2024
YoY Growth in nine months ended Dec 2025 is -77.49% vs -20.47% in Dec 2024
Annual Results Snapshot (Standalone) - Mar'26
YoY Growth in year ended Mar 2026 is -8.92% vs -0.98% in Mar 2025
YoY Growth in year ended Mar 2026 is -76.71% vs -36.57% in Mar 2025
About Jai Balaji Industries Ltd

Company Coordinates


