Jai Corp

  • Market Cap: Small Cap
  • Industry: Plastic Products - Industrial
  • ISIN: INE070D01027
  • NSEID: JAICORPLTD
  • BSEID: 512237
INR
99.52
0.37 (0.37%)
BSENSE

Sep 04, 03:30 PM

BSE+NSE Vol: 2.58 lacs

  • Price Points
  • Score
  • Mojo Parameters
  • Total Return
  • News and Corporate Actions
  • Key factors
  • Shareholding
  • Financials
  • CompanyCV
stock-summaryPrice Point
High/Low

1Day

52 Week

Valuation
Technical
Day's Volume

CASH

2.58 lacs (-7.78%) Volume

Shareholding (Jun 2026)

FII

1.49%

Held by 31 FIIs

DII

1.25%

Held by 2 DIIs

Promoter

73.92%

Why is Jai Corp Ltd falling/rising?

06-Sep-2026

As of 05-Sep, Jai Corp Ltd's stock price is at 99.41, showing a short-term gain but a significant year-to-date decline of 24.63% and a 37.91% drop over the past year, indicating weak long-term growth prospects and low investor confidence.

As of 05-Sep, Jai Corp Ltd's stock price is currently at 99.41, reflecting a change of 0.45 (0.45%) upward. The stock has been gaining for the last two days, with a total return of 1.68% during this period, which indicates a short-term positive momentum. Additionally, the stock has outperformed its sector by 0.42% today, suggesting some investor confidence in the immediate term.<BR><BR>Despite these short-term gains, the stock has shown significant underperformance over longer periods. Year-to-date, it has declined by 24.63%, and over the past year, it has fallen by 37.91%. The company's long-term growth prospects appear weak, with net sales growing at an annual rate of -0.71% over the last five years. Furthermore, the company's profitability is concerning, as indicated by a low return on equity (ROE) of 5.19%, which signifies poor management efficiency.<BR><BR>Investor participation has increased recently, with delivery volume rising by 0.61% against the five-day average, indicating some liquidity in trading. However, the overall sentiment remains cautious, as domestic mutual funds hold only 0.14% of the company, which may reflect a lack of confidence in the stock's valuation and business prospects.<BR><BR>In summary, while Jai Corp Ltd is experiencing a slight rise in stock price in the short term, the broader context of poor long-term performance, low profitability, and limited institutional interest suggests that the stock's overall outlook remains negative.

View full answer

Who are in the management team of Jai Corp?

01-Sep-2026

The management team of Jai Corp includes Anand Jain (Chairman), Virendra Jain (Vice Chairman), Gaurav Jain (CEO), and several independent directors, along with the Company Secretary, Ananjan Datta. They oversee the company's strategic direction and management.

The management team of Jai Corp includes the following key members:<BR><BR>1. **Anand Jain** - Chairman & Non-Executive Director<BR>2. **Virendra Jain** - Vice Chairman & Non-Executive<BR>3. **Gaurav Jain** - Executive Director / Managing Director / CEO / Promoter<BR>4. **Dinesh D. Paliwal** - Executive Non-Independent Director<BR>5. **Priyanka S. Fadia** - Independent Non-Executive Director<BR>6. **Kaushik Deva** - Independent Non-Executive Director<BR>7. **A. J. Jasani** - Independent Non-Executive Director<BR>8. **Shruti Shah** - Independent Non-Executive Director<BR>9. **Ananjan Datta** - Company Secretary & Compliance Officer<BR><BR>This team is responsible for overseeing the strategic direction and management of the company.

View full answer

What does Jai Corp do?

01-Sep-2026

Jai Corp Ltd is a small-cap company engaged in manufacturing plastic products, with a market cap of INR 1,727 Cr. As of June 2026, it reported net sales of 158 Cr and a net profit of 28 Cr.

Overview:<BR>Jai Corp Ltd is engaged in manufacturing within the plastic products industry and operates in the small-cap market segment.<BR><BR>History:<BR>Jai Corp Limited was incorporated on 6 June 1985 and obtained its Certificate of Commencement of Business on 12 June 1985. The latest quarterly results reported net sales and net profit for June 2026.<BR><BR>Financial Snapshot:<BR>Net Sales: 158 Cr (Quarterly Results - Jun 2026) <BR>Net Profit: 28 Cr (Quarterly Results - Jun 2026) <BR>Market Cap: INR 1,727 Cr (Small Cap)<BR><BR>Key Metrics:<BR>P/E: 18.00 <BR>Industry P/E: 28 <BR>Dividend Yield: 0.51% <BR>Debt-Equity: -0.33 <BR>Return on Equity: 11.44% <BR>Price to Book: 1.18 <BR><BR>Contact Details:<BR>Address: A-3 MIDC Industrial Area, Nanded Maharashtra: 431603 <BR>Tel: 91-22-61155300/22817051 <BR>Email: cs2@jaicorpindia.com <BR>Website: http://www.jaicorpindia.com

View full answer

Who are the peers of the Jai Corp?

01-Sep-2026

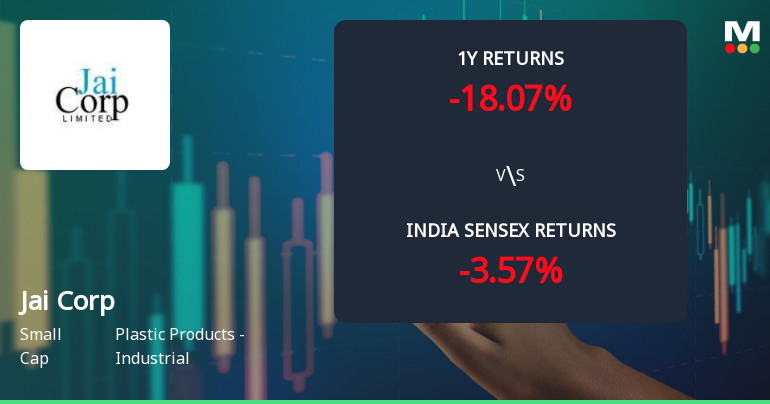
Jai Corp's peers include Time Technoplast, Kingfa Science, and Prince Pipes, among others. Kingfa Science leads in 1-year returns at 44.59%, while Jai Corp's return is -18.07%.

Peers: The peers of Jai Corp are Time Technoplast, Kingfa Science, Prince Pipes, Apollo Pipes, Jain Irrigation, All Time Plastic, Premier Polyfilm, Prakash Pipes, and Dhabriya Poly.<BR><BR>Quality Snapshot: Excellent management risk is observed at Time Technoplast and Dhabriya Poly, while Average management risk is found at Kingfa Science, Prince Pipes, Apollo Pipes, Premier Polyfilm, and Prakash Pipes, and the rest have Below Average management risk. Growth is Excellent at Kingfa Science, Good at Time Technoplast, Jain Irrigation, and Dhabriya Poly, while Average growth is seen at Apollo Pipes, Premier Polyfilm, and Prakash Pipes, and the rest have Below Average growth. Excellent capital structure is noted at Jai Corp, Time Technoplast, Kingfa Science, Prince Pipes, Apollo Pipes, Premier Polyfilm, and Prakash Pipes, while the rest have Below Average or Average capital structure.<BR><BR>Return Snapshot: Kingfa Science has the highest 1-year return at 44.59%, while Jain Irrigation has the lowest at -42.90%, with Jai Corp's own 1-year return at -18.07%, which is better than Jain Irrigation but worse than Kingfa Science. Additionally, the six-month return is negative for Jai Corp, Jain Irrigation, All Time Plastic, and Dhabriya Poly.

View full answer

How big is Jai Corp?

01-Sep-2026

As of 31st August, Jai Corp Ltd has a market capitalization of 1,727.00 Cr, with recent net sales of 540.67 Cr and net profit of 93.20 Cr over the last four quarters.

As of 31st August, <BR><BR>Market Cap: Jai Corp Ltd has a market capitalization of 1,727.00 Cr, categorizing it as a Small Cap company.<BR><BR>Recent Quarterly Performance: The sum of Net Sales for the latest 4 quarters is 540.67 Cr, while the sum of Net Profit for the same period is 93.20 Cr.<BR><BR>Balance Sheet Snapshot: The reporting period is March 2026, with Shareholder's Funds amounting to 1,491.48 Cr and Total Assets totaling 1,538.72 Cr.

View full answer

Should I buy, sell or hold Jai Corp Ltd?

15-Aug-2026

When is the next results date for Jai Corp Ltd?

06-Aug-2026

The next results date for Jai Corp Ltd is 13 August 2026.

The next results date for Jai Corp Ltd is scheduled for 13 August 2026.

View full answer

Are Jai Corp Ltd latest results good or bad?

01-Jun-2026

Jai Corp Ltd's latest results show an 18.51% sequential increase in net profit and improved operating margins, but year-on-year net sales and profit declined by 10.90% and 10.80%, respectively. The company's heavy reliance on other income raises concerns about the sustainability of its earnings, indicating mixed performance overall.

Jai Corp Ltd's latest results present a mixed picture. On one hand, there was a sequential improvement in net profit, which rose by 18.51% quarter-on-quarter to ₹20.74 crores, and net sales increased by 3.88% to ₹120.62 crores. Additionally, the operating margin improved to 13.20%, the highest in seven quarters, indicating some success in cost management.<BR><BR>However, the year-on-year performance remains concerning. Net sales fell by 10.90% compared to the same quarter last year, continuing a trend of revenue contraction that has persisted for multiple quarters. The net profit also declined by 10.80% year-on-year, reflecting ongoing challenges in maintaining earnings momentum.<BR><BR>Moreover, the company's heavy reliance on other income, which accounted for 52.80% of profit before tax, raises questions about the sustainability of its earnings. This reliance suggests that the core operational health of the business may not be as strong as the headline numbers indicate.<BR><BR>Overall, while there are some positive sequential trends, the year-on-year declines and concerns over earnings quality paint a cautious picture for investors. The company faces significant structural challenges, making it a cautious story for those seeking sustainable growth and operational excellence.

View full answer

Is Jai Corp technically bullish or bearish?

25-Nov-2025

As of November 24, 2025, Jai Corp's technical trend is mildly bearish, driven by mixed indicators including a bearish MACD and KST on the monthly charts, despite some mildly bullish signals on the daily and weekly Bollinger Bands.

As of 24 November 2025, the technical trend has changed from mildly bullish to mildly bearish. The current technical stance for Jai Corp is mildly bearish. Key indicators driving this include the MACD showing mildly bearish on the weekly and bearish on the monthly, along with the KST indicating mildly bearish on the weekly and bearish on the monthly. The Bollinger Bands are mildly bullish on the weekly but bearish on the monthly, while moving averages are mildly bullish on the daily. Overall, the mixed signals suggest a cautious outlook with bearish tendencies prevailing.

View full answer

How has been the historical performance of Jai Corp?

24-Nov-2025

Jai Corp's historical performance shows fluctuating sales, peaking at 720.09 Cr in Mar'22 and declining to 517.70 Cr in Mar'25, while profitability improved significantly, with net profit rising from a loss of 13.60 Cr in Mar'23 to a profit of 66.55 Cr in Mar'25. Total liabilities and assets decreased, indicating a recovery in profitability despite sales volatility.

Answer:<BR>The historical performance of Jai Corp shows a fluctuating trend in its financial metrics over the years.<BR><BR>Breakdown:<BR>Jai Corp's net sales have varied significantly, peaking at 720.09 Cr in Mar'22 before declining to 517.70 Cr in Mar'25. The total operating income followed a similar trajectory, reaching a high of 720.09 Cr in Mar'22 and dropping to 517.70 Cr in Mar'25. The raw material costs also saw fluctuations, with a peak of 532.21 Cr in Mar'22 and a decrease to 356.00 Cr in Mar'25. Operating profit (PBDIT) has shown some recovery, increasing from 49.36 Cr in Mar'24 to 52.64 Cr in Mar'25, while profit before tax improved significantly from 13.34 Cr in Mar'23 to 82.98 Cr in Mar'25. The profit after tax also rebounded from a loss of 5.02 Cr in Mar'23 to a profit of 66.95 Cr in Mar'25. The consolidated net profit mirrored this trend, moving from a loss of 13.60 Cr in Mar'23 to a profit of 66.55 Cr in Mar'25. On the balance sheet, total liabilities decreased from 1,533.26 Cr in Mar'24 to 1,446.97 Cr in Mar'25, while total assets also declined from 1,533.26 Cr to 1,446.97 Cr in the same period. Cash flow from operating activities improved to 44.00 Cr in Mar'25, while cash flow from investing activities showed a positive shift to 111.00 Cr. Overall, Jai Corp's financial performance reflects a recovery in profitability and a reduction in liabilities, despite fluctuations in sales and total assets.

View full answer

Is Jai Corp overvalued or undervalued?

19-Aug-2025

As of August 18, 2025, Jai Corp is considered very expensive and overvalued compared to its peers, with a PE ratio of 13.50 and a significant underperformance of -65.48% over the past year against the Sensex's 1.04% return.

As of 18 August 2025, the valuation grade for Jai Corp has moved from expensive to very expensive. The company is currently overvalued based on its financial metrics. Key ratios include a PE ratio of 13.50, an EV to EBITDA of 41.34, and a PEG ratio of 0.09, all suggesting a high valuation relative to earnings growth potential.<BR><BR>In comparison to its peers, Jai Corp's valuation stands out as very expensive, particularly when juxtaposed with K P R Mill Ltd, which has a PE ratio of 41.32, and Trident, which is rated fair with a PE of 32.92. The disparity in valuations indicates that Jai Corp is not only overvalued but also significantly mispriced compared to its industry counterparts. Additionally, the stock has underperformed the Sensex over the past year, with a return of -65.48% compared to the Sensex's 1.04%, reinforcing the notion of overvaluation.

View full answer

Who are the top shareholders of the Jai Corp?

06-Jun-2025

The top shareholders of Jai Corp include promoter Harsh Jain with 13.05%, individual investors with 19.39%, and the Life Insurance Corporation of India at 1.53%. There are no pledged promoter holdings.

The top shareholders of Jai Corp include the promoters, with Harsh Jain being the promoter with the highest holding at 13.05%. Additionally, individual investors collectively hold 19.39% of the shares. The Life Insurance Corporation of India is the highest public shareholder, holding 1.53%. There are also 11 mutual fund schemes that hold a total of 0.11%, and 42 foreign institutional investors (FIIs) that hold 1.4%. Notably, there are no pledged promoter holdings.

View full answer

What is the bonus history of the Jai Corp?

06-Jun-2025

Jai Corp's bonus history includes a 1:1 bonus issue announced on October 5, 2007, with a record date of October 12, 2007, allowing shareholders to receive one additional share for each share held.

Jai Corp has a bonus history that includes a 1:1 bonus issue, which was announced with an ex-date of October 5, 2007. The record date for this bonus was October 12, 2007. This means that shareholders on record as of the record date were entitled to receive one additional share for every share they held.

View full answer

Has Jai Corp declared dividend?

06-Jun-2025

Yes, Jai Corp Ltd. has declared a 50% dividend, amounting to 0.5 per share, with an ex-date of August 27, 2024. Despite this dividend, the company has experienced significant declines in price returns over shorter periods, although it shows a positive total return over the past five years.

Jai Corp Ltd. has declared a 50% dividend.<BR><BR>Dividend Details:<BR>- Percentage announced: 50%<BR>- Amount per share: 0.5<BR>- Ex-date: Aug-27-2024<BR><BR>Dividend Yield: 0.41%.<BR><BR>Total Returns by Period:<BR>In the last 6 months, the price return was -68.72%, the dividend return was 0%, resulting in a total return of -68.72%.<BR><BR>Over the past year, the price return was -59.66%, with a dividend return of 0.13%, leading to a total return of -59.53%.<BR><BR>In the 2-year period, the price return was -32.57%, the dividend return was 0.58%, resulting in a total return of -31.99%.<BR><BR>For the 3-year period, the price return was -5.58%, the dividend return was 1.48%, leading to a total return of -4.1%.<BR><BR>In the last 4 years, the price return was -1.95%, the dividend return was 1.26%, resulting in a total return of -0.69%.<BR><BR>Over the past 5 years, the price return was 51.31%, with a dividend return of 2.73%, leading to a total return of 54.04%.<BR><BR>Overall, Jai Corp Ltd. has declared a dividend, but the total returns over various periods indicate significant declines in price returns, particularly in the shorter terms, despite a positive total return over the 5-year period.

View full answer
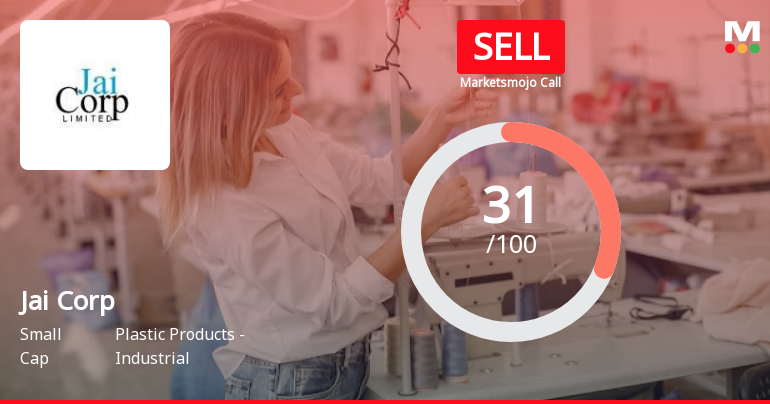
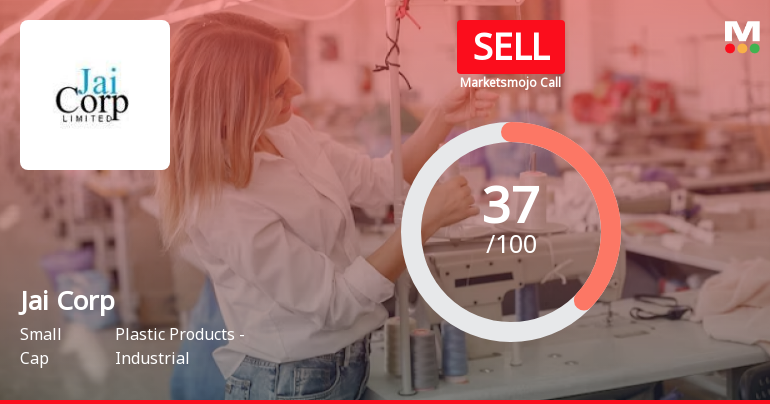
iScoreScore
Click here to find our call on this stock
Strong Sell
Sell
Hold
Buy
Strong Buy

Dashboard

1

Poor Management Efficiency with a low ROE of 5.19%

  • The company has been able to generate a Return on Equity (avg) of 5.19% signifying low profitability per unit of shareholders funds
2

Poor long term growth as Net Sales has grown by an annual rate of -0.71% over the last 5 years

 
3

Flat results in Jun 26

4

With ROE of 11.4, it has a Expensive valuation with a 1.2 Price to Book Value

5

Despite the size of the company, domestic mutual funds hold only 0.14% of the company

6

Below par performance in long term as well as near term

stock-summaryMojo Parameters

Mojo Parameters

Loading Valuation Snapshot...

Stock DNA

stock-summary
Industry

Plastic Products - Industrial

stock-summary
Market cap

INR 1,746 Cr (Small Cap)

stock-summary
P/E

19.00

stock-summary
Industry P/E

28

stock-summary
Dividend Yield

0.51%

stock-summary
Debt Equity

-0.33

stock-summary
Return on Equity

11.44%

stock-summary
Price to Book

1.17

Revenue and Profits:
Net Sales:
158 Cr
(Quarterly Results - Jun 2026)
Net Profit:
28 Cr
stock-summaryTotal Returns
Total Returns (Price + Dividend) stock-summary
Dividend Yield (0.51%)
TimePeriod
Price Return
Dividend Return
Total Return
3 Months
-12.16%
0.44%
-11.72%
6 Months
-0.52%
0.48%
-0.04%
1 Year
-37.78%
0.63%
-37.15%
2 Years
-72.98%
1.69%
-71.29%
3 Years
-58.93%
3.12%
-55.81%
4 Years
-28.4%
4.16%
-24.24%
5 Years
-26.5%
6.03%
-20.47%

Latest dividend: 0.5 per share ex-dividend date: Sep-19-2025

Risk Adjusted Returns v/s stock-summary
Returns Beta
Icon
Beta has not been calculated since enough price history is not available
stock-summaryNews & Corporate Actions

Announcements stock-summary

Jai Corp Limited - Registrar & Share Transfer Agent Update

09-Dec-2019 | Source : NSE

Jai Corp Limited has informed the Exchange regarding the Registrar & Share Transfer Agent Update that the name of the Registrar and Share Transfer Agent has been changed from Karvy Fintech Private Limited to KFin Technologies Private Limited.

Jai Corp Limited - Scheme of Arrangement

15-Nov-2019 | Source : NSE

Jai Corp Limited has informed the Exchange about Scheme of Arrangement This is further to our intimation dated August 22, 2019.

Jai Corp Limited - Outcome of Board Meeting

14-Nov-2019 | Source : NSE

Jai Corp Limited has informed the Exchange regarding Board meeting held on November 13, 2019. Outcome of the Board Meeting held on 13th November 2019.

Corporate Actions stock-summary

stock-summary
BOARD MEETING

No Upcoming Board Meetings

stock-summary
DIVIDEND

Jai Corp Ltd has declared 50% dividend, ex-date: 21 Sep 26

stock-summary
SPLITS

Jai Corp Ltd has announced 1:10 stock split, ex-date: 05 Oct 07

stock-summary
BONUS

Jai Corp Ltd has announced 1:1 bonus issue, ex-date: 05 Oct 07

stock-summary
RIGHTS

No Rights history available

stock-summaryKey Factors

Quality key factors stock-summary

Factor
Value
Sales Growth (5y)
-0.71%
EBIT Growth (5y)
4.25%
EBIT to Interest (avg)
38.99
Debt to EBITDA (avg)
0.12
Net Debt to Equity (avg)
-0.33
Sales to Capital Employed (avg)
0.39
Tax Ratio
23.50%
Dividend Payout Ratio
13.19%
Pledged Shares
0
Institutional Holding
2.74%
ROCE (avg)
3.35%
ROE (avg)
5.19%

Valuation key factors

Factor
Value
P/E Ratio
19
Industry P/E
28
Price to Book Value
1.17
EV to EBIT
21.72
EV to EBITDA
17.97
EV to Capital Employed
1.26
EV to Sales
2.32
PEG Ratio
NA
Dividend Yield
0.51%
ROCE (Latest)
4.28%
ROE (Latest)
11.44%

Technicals key factors

Indicator
Weekly
Monthly
MACD
Bearish
Mildly Bullish
RSI
No Signal
No Signal
Bollinger Bands
Bearish
Mildly Bearish
Moving Averages
Bearish (Daily)
KST
Bearish
Mildly Bullish
Dow Theory
Mildly Bearish
Mildly Bearish
OBV
Mildly Bullish
No Trend
stock-summary Technical Indicator Scale: Bearish, Mildly Bearish, Sideways, Mildly Bullish, Bullish  Turned 
stock-summaryShareholding
Shareholding Snapshot : Jun 2026stock-summary
Shareholding Compare (%holding) stock-summary
Majority shareholders

Promoters

Pledged Promoter Holdings

None

Mutual Funds

Held by 7 Schemes (0.04%)

FIIs

Held by 31 FIIs (1.49%)

Promoter with highest holding

Harsh Jain (13.05%)

Highest Public shareholder

Life Insurance Corporation Of India (1.2%)

Individual Investors Holdings

19.68%

stock-summaryFinancial
[
  {
    "link": "quarterly",
    "btn_text": "All Quarterly Results",
    "header": "Quarterly Results Snapshot (Consolidated) - Jun'26 - QoQ",
    "rhs": [
      {
        "prefix": "Net Sales ",
        "suffix": "QoQ Growth in quarter ended Jun 2026 is 30.64% vs 3.88% in Mar 2026",
        "dir": 1
      },
      {
        "prefix": "Consolidated Net Profit ",
        "suffix": "QoQ Growth in quarter ended Jun 2026 is 36.02% vs 18.51% in Mar 2026",
        "dir": 1
      }
    ],
    "table": {
      "header": [
        "Jun'26",
        "Mar'26",
        "Change(%)"
      ],
      "body": [
        {
          "field": "Net Sales",
          "val1": "157.58",
          "val2": "120.62",
          "chgp": "30.64%",
          "chgp_class": "positive"
        },
        {
          "field": "Operating Profit (PBDIT) excl Other Income",
          "val1": "23.76",
          "val2": "15.92",
          "chgp": "49.25%",
          "chgp_class": "positive"
        },
        {
          "field": "Interest",
          "val1": "0.05",
          "val2": "0.06",
          "chgp": "-16.67%",
          "chgp_class": "positive"
        },
        {
          "field": "Exceptional Items",
          "val1": "-0.05",
          "val2": "-0.08",
          "chgp": "37.50%",
          "chgp_class": "positive"
        },
        {
          "field": "Consolidate Net Profit",
          "val1": "28.21",
          "val2": "20.74",
          "chgp": "36.02%",
          "chgp_class": "positive"
        },
        {
          "field": "Operating Profit Margin (Excl OI)",
          "val1": "15.08%",
          "val2": "13.20%",
          "chgp": "1.88%",
          "chgp_class": "positive"
        }
      ]
    }
  },
  {
    "link": "half-yearly",
    "btn_text": "All Half Yearly Results",
    "header": "Half Yearly Results Snapshot (Consolidated) - Sep'25",
    "rhs": [
      {
        "prefix": "Net Sales ",
        "suffix": " Growth in half year ended Sep 2025 is 8.32% vs 9.79% in Sep 2024",
        "dir": -1
      },
      {
        "prefix": "Consolidated Net Profit ",
        "suffix": " Growth in half year ended Sep 2025 is 323.91% vs 80.02% in Sep 2024",
        "dir": 1
      }
    ],
    "table": {
      "header": [
        "Sep'25",
        "Sep'24",
        "Change(%)"
      ],
      "body": [
        {
          "field": "Net Sales",
          "val1": "277.61",
          "val2": "256.29",
          "chgp": "8.32%",
          "chgp_class": "positive"
        },
        {
          "field": "Operating Profit (PBDIT) excl Other Income",
          "val1": "25.19",
          "val2": "30.06",
          "chgp": "-16.20%",
          "chgp_class": "negative"
        },
        {
          "field": "Interest",
          "val1": "0.10",
          "val2": "0.10",
          "chgp": "",
          "chgp_class": "neutral"
        },
        {
          "field": "Exceptional Items",
          "val1": "-0.13",
          "val2": "-0.08",
          "chgp": "-62.50%",
          "chgp_class": "negative"
        },
        {
          "field": "Consolidate Net Profit",
          "val1": "131.03",
          "val2": "30.91",
          "chgp": "323.91%",
          "chgp_class": "positive"
        },
        {
          "field": "Operating Profit Margin (Excl OI)",
          "val1": "9.07%",
          "val2": "11.73%",
          "chgp": "-2.66%",
          "chgp_class": "negative"
        }
      ]
    }
  },
  {
    "link": "nine-monthly",
    "btn_text": "All Nine Monthly Results",
    "header": "Nine Monthly Results Snapshot (Consolidated) - Dec'25",
    "rhs": [
      {
        "prefix": "Net Sales ",
        "suffix": "YoY Growth in nine months ended Dec 2025 is 2.98% vs 12.34% in Dec 2024",
        "dir": -1
      },
      {
        "prefix": "Consolidated Net Profit ",
        "suffix": "YoY Growth in nine months ended Dec 2025 is 243.03% vs 48.75% in Dec 2024",
        "dir": 1
      }
    ],
    "table": {
      "header": [
        "Dec'25",
        "Dec'24",
        "Change(%)"
      ],
      "body": [
        {
          "field": "Net Sales",
          "val1": "393.72",
          "val2": "382.33",
          "chgp": "2.98%",
          "chgp_class": "positive"
        },
        {
          "field": "Operating Profit (PBDIT) excl Other Income",
          "val1": "38.51",
          "val2": "42.42",
          "chgp": "-9.22%",
          "chgp_class": "negative"
        },
        {
          "field": "Interest",
          "val1": "0.13",
          "val2": "0.15",
          "chgp": "-13.33%",
          "chgp_class": "positive"
        },
        {
          "field": "Exceptional Items",
          "val1": "-1.60",
          "val2": "-0.15",
          "chgp": "-966.67%",
          "chgp_class": "negative"
        },
        {
          "field": "Consolidate Net Profit",
          "val1": "148.53",
          "val2": "43.30",
          "chgp": "243.03%",
          "chgp_class": "positive"
        },
        {
          "field": "Operating Profit Margin (Excl OI)",
          "val1": "9.78%",
          "val2": "11.10%",
          "chgp": "-1.32%",
          "chgp_class": "negative"
        }
      ]
    }
  },
  {
    "link": "annual",
    "btn_text": "All Annual Results",
    "header": "Annual Results Snapshot (Consolidated) - Mar'26",
    "rhs": [
      {
        "prefix": "Net Sales ",
        "suffix": "YoY Growth in year ended Mar 2026 is -0.65% vs 11.80% in Mar 2025",
        "dir": -1
      },
      {
        "prefix": "Consolidated Net Profit ",
        "suffix": "YoY Growth in year ended Mar 2026 is 154.35% vs 26.69% in Mar 2025",
        "dir": 1
      }
    ],
    "table": {
      "header": [
        "Mar'26",
        "Mar'25",
        "Change(%)"
      ],
      "body": [
        {
          "field": "Net Sales",
          "val1": "514.34",
          "val2": "517.70",
          "chgp": "-0.65%",
          "chgp_class": "negative"
        },
        {
          "field": "Operating Profit (PBDIT) excl Other Income",
          "val1": "54.43",
          "val2": "52.64",
          "chgp": "3.40%",
          "chgp_class": "positive"
        },
        {
          "field": "Interest",
          "val1": "0.19",
          "val2": "0.21",
          "chgp": "-9.52%",
          "chgp_class": "positive"
        },
        {
          "field": "Exceptional Items",
          "val1": "-1.68",
          "val2": "-0.36",
          "chgp": "-366.67%",
          "chgp_class": "negative"
        },
        {
          "field": "Consolidate Net Profit",
          "val1": "169.27",
          "val2": "66.55",
          "chgp": "154.35%",
          "chgp_class": "positive"
        },
        {
          "field": "Operating Profit Margin (Excl OI)",
          "val1": "10.58%",
          "val2": "10.17%",
          "chgp": "0.41%",
          "chgp_class": "positive"
        }
      ]
    }
  }
]

Quarterly Results Snapshot (Consolidated) - Jun'26 - QoQstock-summary

Jun'26
Mar'26
Change(%)
Net Sales
157.58
120.62
30.64%
Operating Profit (PBDIT) excl Other Income
23.76
15.92
49.25%
Interest
0.05
0.06
-16.67%
Exceptional Items
-0.05
-0.08
37.50%
Consolidate Net Profit
28.21
20.74
36.02%
Operating Profit Margin (Excl OI)
15.08%
13.20%
1.88%
Values in Rs Cr.
Direction Arrows
Net Sales

QoQ Growth in quarter ended Jun 2026 is 30.64% vs 3.88% in Mar 2026

Direction Arrows
Consolidated Net Profit

QoQ Growth in quarter ended Jun 2026 is 36.02% vs 18.51% in Mar 2026

Half Yearly Results Snapshot (Consolidated) - Sep'25stock-summary

Sep'25
Sep'24
Change(%)
Net Sales
277.61
256.29
8.32%
Operating Profit (PBDIT) excl Other Income
25.19
30.06
-16.20%
Interest
0.10
0.10
Exceptional Items
-0.13
-0.08
-62.50%
Consolidate Net Profit
131.03
30.91
323.91%
Operating Profit Margin (Excl OI)
9.07%
11.73%
-2.66%
Values in Rs Cr.
Direction Arrows
Net Sales

Growth in half year ended Sep 2025 is 8.32% vs 9.79% in Sep 2024

Direction Arrows
Consolidated Net Profit

Growth in half year ended Sep 2025 is 323.91% vs 80.02% in Sep 2024

Nine Monthly Results Snapshot (Consolidated) - Dec'25stock-summary

Dec'25
Dec'24
Change(%)
Net Sales
393.72
382.33
2.98%
Operating Profit (PBDIT) excl Other Income
38.51
42.42
-9.22%
Interest
0.13
0.15
-13.33%
Exceptional Items
-1.60
-0.15
-966.67%
Consolidate Net Profit
148.53
43.30
243.03%
Operating Profit Margin (Excl OI)
9.78%
11.10%
-1.32%
Values in Rs Cr.
Direction Arrows
Net Sales

YoY Growth in nine months ended Dec 2025 is 2.98% vs 12.34% in Dec 2024

Direction Arrows
Consolidated Net Profit

YoY Growth in nine months ended Dec 2025 is 243.03% vs 48.75% in Dec 2024

Annual Results Snapshot (Consolidated) - Mar'26stock-summary

Mar'26
Mar'25
Change(%)
Net Sales
514.34
517.70
-0.65%
Operating Profit (PBDIT) excl Other Income
54.43
52.64
3.40%
Interest
0.19
0.21
-9.52%
Exceptional Items
-1.68
-0.36
-366.67%
Consolidate Net Profit
169.27
66.55
154.35%
Operating Profit Margin (Excl OI)
10.58%
10.17%
0.41%
Values in Rs Cr.
Direction Arrows
Net Sales

YoY Growth in year ended Mar 2026 is -0.65% vs 11.80% in Mar 2025

Direction Arrows
Consolidated Net Profit

YoY Growth in year ended Mar 2026 is 154.35% vs 26.69% in Mar 2025

stock-summaryCompany CV
About Jai Corp Ltd stock-summary
stock-summary
Jai Corp Ltd
Small Cap
Plastic Products - Industrial
Jai Corp Limited (JCL) was incorporated on 6 June, 1985. The Company obtained Certificate of Commencement of Business on 12th June, 1985. The Company has traditionally been into manufacturing businesses like steel, plastic processing and spinning yarn. Apart from expansion of its plastic processing business, it is now focusing and investing in emerging opportunities like developing SEZs, infrastructure, venture capital and real estate.
Company Coordinates stock-summary
Company Details
A-3 MIDC Industrial Area , Nanded Maharashtra : 431603
stock-summary
Tel: 91-22-61155300/22817051
stock-summary
cs2@jaicorpindia.com
Registrar Details
Karvy Computershare Pvt Ltd., Karvy Selenium, Tower-B Plot No 31 & 32, Survey No 116/22, 115/24, 115/25, Financial District, Nanakramguda, Serilingampally, Mandal Ranga Reddy Dist, Hyderabad