
Compare Jain Resource with Similar Stocks
Stock DNA
Non - Ferrous Metals
INR 12,459 Cr (Small Cap)
33.00
14
0.00%
0.60
22.47%
8.32
Total Returns (Price + Dividend) 
Jain Resource for the last several years.
Risk Adjusted Returns v/s
Returns Beta

News
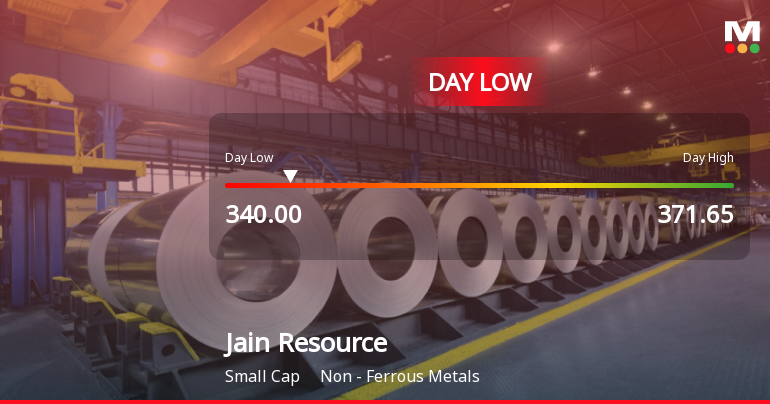
Jain Resource Recycling Ltd Hits Intraday Low Amid Price Pressure
Jain Resource Recycling Ltd experienced a notable decline today, touching an intraday low of Rs 349.9, reflecting a 5.11% drop as the stock underperformed its sector and broader market indices amid prevailing price pressures and subdued market sentiment.
Read full news article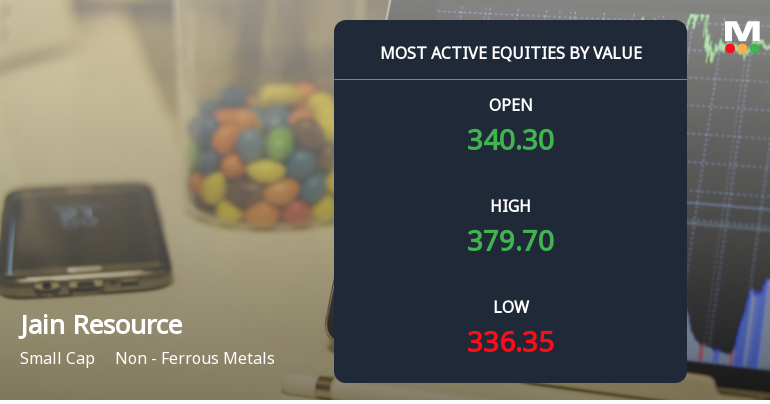
Jain Resource Recycling Ltd Sees Robust Trading Activity Amid Sector Outperformance
Jain Resource Recycling Ltd (JAINREC), a small-cap player in the Non-Ferrous Metals sector, witnessed a significant uptick in trading value on 9 June 2026, outperforming its sector and broader market indices. Despite a recent downgrade in its Mojo Grade from Hold to Sell, the stock recorded an impressive 8.15% gain in a volatile session marked by high volume and wide price swings.
Read full news article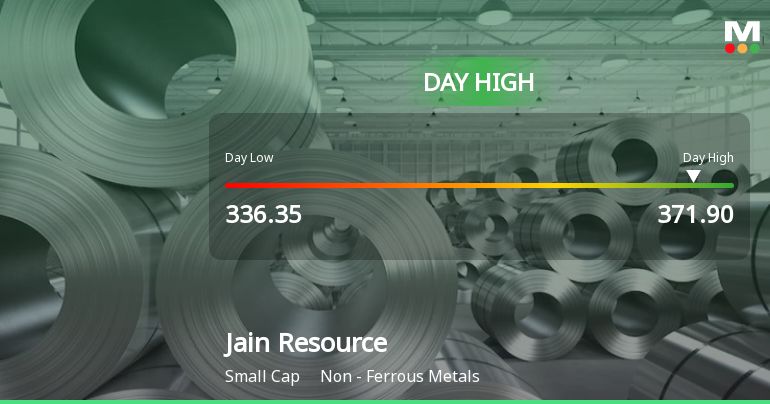
Jain Resource Recycling Ltd Surges 7.7% to Day's High of Rs 366.95 — Outperforms Sector by 6.91 Percentage Points
The Sensex edged up 0.28% on 09 Jun 2026, while Jain Resource Recycling Ltd surged 7.7%, outperforming its Non - Ferrous Metals sector by nearly 7 percentage points. This sharp single-session gain stands out amid a broadly subdued market environment, signalling a stock-specific event rather than a general market uplift.
Read full news article Announcements
Announcement under Regulation 30 (LODR)-Analyst / Investor Meet - Intimation
08-Jun-2026 | Source : BSESchedule of Analyst / Institutional Investor Meeting
Announcement under Regulation 30 (LODR)-Analyst / Investor Meet - Outcome
25-May-2026 | Source : BSEEarnings Call Transcript for the quarter and year ended March 31 2026
Announcement under Regulation 30 (LODR)-Analyst / Investor Meet - Intimation
22-May-2026 | Source : BSEIntimation of Schedule of Analyst / Institutional Investor meeting under the SEBI (Listing Obligations and Disclosure Requirements) Regulations 2015
Corporate Actions

No Upcoming Board Meetings

No Dividend history available

No Splits history available

No Bonus history available

No Rights history available
Quality key factors
Valuation key factors
Technicals key factors
 Technical Indicator Scale: Bearish, Mildly Bearish, Sideways, Mildly Bullish, Bullish Turned
 Shareholding Snapshot : Mar 2026
Shareholding Compare (%holding)
Promoters
None
Held by 17 Schemes (6.13%)
Held by 26 FIIs (3.02%)
Kamlesh Jain (65.87%)
Shanthilal Jain (4.54%)
9.64%
Quarterly Results Snapshot (Standalone) - Mar'26 - QoQ

QoQ Growth in quarter ended Mar 2026 is 13.23% vs 30.23% in Dec 2025
QoQ Growth in quarter ended Mar 2026 is -51.15% vs 28.65% in Dec 2025
Half Yearly Results Snapshot (Standalone) - Sep'25
Not Applicable: The company has declared_date for only one period
Not Applicable: The company has declared_date for only one period
Nine Monthly Results Snapshot (Standalone) - Dec'25
Not Applicable: The company has declared_date for only one period
Not Applicable: The company has declared_date for only one period
Annual Results Snapshot (Standalone) - Mar'26

YoY Growth in year ended Mar 2026 is 50.26% vs 47.80% in Mar 2025
YoY Growth in year ended Mar 2026 is 64.19% vs 32.33% in Mar 2025
About Jain Resource Recycling Ltd

Company Coordinates


