
Compare Jainam Ferro with Similar Stocks
Dashboard
Poor Management Efficiency with a low ROE of 6.62%
- The company has been able to generate a Return on Equity (avg) of 6.62% signifying low profitability per unit of shareholders funds
The company is Net-Debt Free
Poor long term growth as Operating profit has grown by an annual rate 1.62% of over the last 5 years
Flat results in Sep 23
With ROE of 4.4, it has a Very Expensive valuation with a 1.9 Price to Book Value
Total Returns (Price + Dividend) 
Jainam Ferro for the last several years.
Risk Adjusted Returns v/s
Returns Beta

News
Jainam Ferro Alloys (I) Ltd is Rated Hold by MarketsMOJO
Jainam Ferro Alloys (I) Ltd is rated 'Hold' by MarketsMOJO, with this rating last updated on 23 June 2026. However, the analysis and financial metrics discussed here reflect the company’s current position as of 14 July 2026, providing investors with an up-to-date view of its fundamentals, valuation, financial trends, and technical outlook.
Read full news article
Jainam Ferro Alloys (I) Ltd is Rated Hold
Jainam Ferro Alloys (I) Ltd is rated 'Hold' by MarketsMOJO, with this rating last updated on 23 June 2026. While the rating was revised on that date, the analysis and financial metrics presented here reflect the stock's current position as of 03 July 2026, providing investors with an up-to-date view of the company's fundamentals, valuation, financial trend, and technical outlook.
Read full news article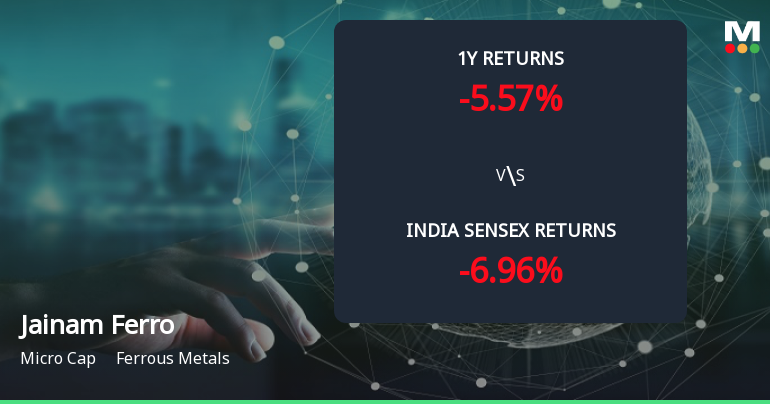
Golden Cross Forms in Jainam Ferro Alloys (I) Ltd — On a Day the Stock Was Flat. What the Mixed Signals Mean
The 50-day moving average has crossed above the 200-day moving average for Jainam Ferro Alloys (I) Ltd, signalling a golden cross on 23 Jun 2026. Yet, the stock closed unchanged on the day, while monthly momentum indicators remain mildly bearish. This juxtaposition of signals calls for a detailed examination of the technical and fundamental backdrop to assess the reliability of this crossover.
Read full news article Announcements
Corporate Actions

No Upcoming Board Meetings

No Dividend history available

No Splits history available

No Bonus history available

No Rights history available
Quality key factors
Valuation key factors
Technicals key factors
 Technical Indicator Scale: Bearish, Mildly Bearish, Sideways, Mildly Bullish, Bullish Turned
 Shareholding Snapshot : Mar 2026
Shareholding Compare (%holding)
Promoters
None
Held by 0 Schemes
Held by 0 FIIs
Aditya Parakh (25.06%)
Wallfort Financial Services Ltd (12.81%)
16.08%
Half Yearly Results Snapshot (Consolidated) - Mar'26

Growth in half year ended Mar 2026 is -9.80% vs 0.91% in Sep 2025
Growth in half year ended Mar 2026 is -78.81% vs 167.66% in Sep 2025
Nine Monthly Results Snapshot (Consolidated) - Sep'23
Not Applicable: The company has declared_date for only one period
Not Applicable: The company has declared_date for only one period
Annual Results Snapshot (Consolidated) - Mar'26
YoY Growth in year ended Mar 2026 is -7.08% vs 16.87% in Mar 2025
YoY Growth in year ended Mar 2026 is -34.80% vs 86.92% in Mar 2025
About Jainam Ferro Alloys (I) Ltd

Company Coordinates


