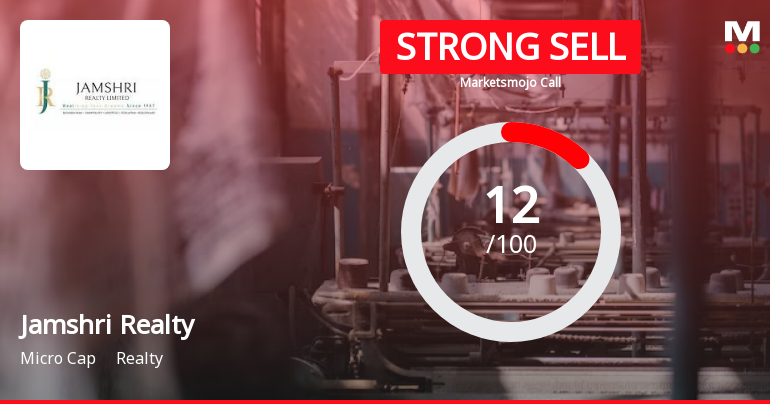
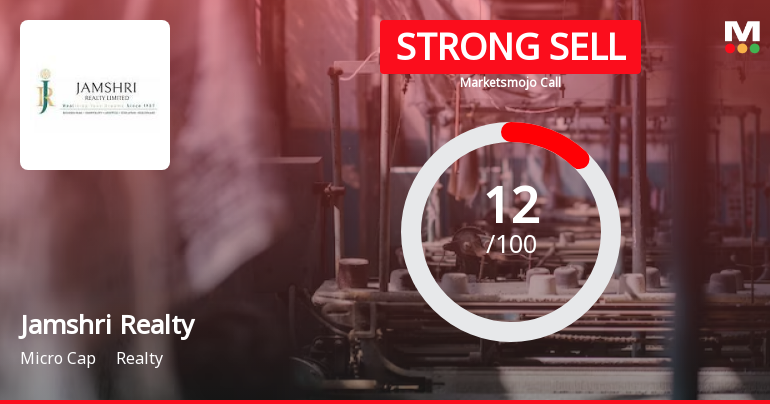
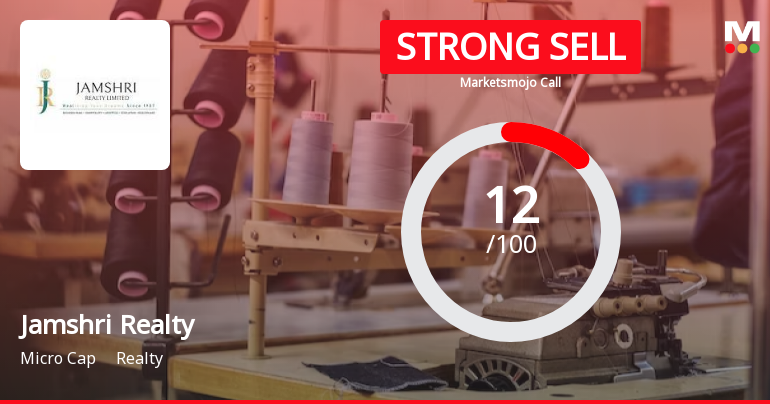
Jamshri Realty

  • Market Cap: Micro Cap
  • Industry: Realty
  • ISIN: INE462D01034
  • NSEID:
  • BSEID: 502901
INR
75.80
-0.17 (-0.22%)
BSENSE

Aug 07, 03:30 PM

BSE+NSE Vol: 1.52 k

  • Price Points
  • Score
  • Mojo Parameters
  • Total Return
  • News and Corporate Actions
  • Key factors
  • Shareholding
  • Financials
  • CompanyCV
stock-summaryPrice Point
High/Low

1Day

52 Week

Valuation
Technical
Day's Volume

CASH

1.52 k (37.25%) Volume

Shareholding (Jun 2026)

FII

0.00%

Held by 0 FIIs

DII

0.35%

Held by 1 DIIs

Promoter

63.40%

Why is Jamshri Realty Ltd falling/rising?

09-Aug-2026

As of 08-Aug, Jamshri Realty Ltd's stock price is 75.80, down 0.22%, and has underperformed the sector today. The stock has declined 23.43% year-to-date and 30.36% over the past year, with a bearish trend indicated by its moving averages.

As of 08-Aug, Jamshri Realty Ltd's stock price is currently at 75.80, reflecting a decrease of 0.17, or 0.22%. The stock has underperformed compared to the sector by 0.7% today and has experienced a trend reversal, falling after two consecutive days of gains. Over the past week, the stock has declined by 0.04%, while the benchmark Sensex has increased by 0.52%. <BR><BR>In terms of longer-term performance, the stock has seen a significant decline of 23.43% year-to-date and 30.36% over the past year, contrasting sharply with the Sensex's decline of only 7.89% and 2.63%, respectively. Additionally, there has been a notable drop in investor participation, with delivery volume on August 6 falling by 31.96% compared to the five-day average. <BR><BR>The stock's moving averages indicate that while it is higher than the five-day moving average, it remains lower than the 20-day, 50-day, 100-day, and 200-day moving averages, suggesting a bearish trend. Overall, these factors contribute to the stock's current decline.

View full answer

Are Jamshri Realty Ltd latest results good or bad?

24-Jul-2026

Jamshri Realty Ltd's latest results show a slight improvement with a net profit of ₹0.18 crores, but overall performance is concerning due to an 80% decline in profit year-on-year, ongoing revenue challenges, and structural issues like negative book value and high interest burdens. Investors should be cautious as the company's long-term viability is uncertain.

Jamshri Realty Ltd's latest results present a mixed picture, but overall, they lean towards a negative assessment. The company reported a net profit of ₹0.18 crores for Q1 FY27, which is an improvement from a loss of ₹0.30 crores in the previous quarter. However, this profit is still significantly lower—by 80%—compared to the ₹0.10 crores profit in the same quarter last year.<BR><BR>Revenue-wise, the company experienced a year-on-year decline of 8.15%, indicating ongoing demand challenges, despite a sequential improvement in net sales from ₹1.52 crores to ₹1.69 crores. The operating margin improved dramatically to 39.05%, primarily due to reduced employee costs, but this improvement raises concerns about sustainability without corresponding revenue growth.<BR><BR>Additionally, the company faces serious structural issues, including a negative book value of ₹-12.86 per share and a high interest burden that consumes nearly half of its gross revenues. The persistent decline in promoter holdings and the absence of institutional investor interest further complicate the outlook.<BR><BR>Overall, while there are some signs of operational improvement in the latest quarter, the fundamental financial distress and ongoing challenges suggest that the results are more cautionary than positive. Investors should approach with caution, as the company's long-term viability remains in question.

View full answer

When is the next results date for Jamshri Realty Ltd?

15-Jul-2026

The next results date for Jamshri Realty Ltd is 23 July 2026.

The next results date for Jamshri Realty Ltd is scheduled for 23 July 2026.

View full answer

How big is Jamshri Realty?

11-Jun-2026

As of 10th June, Jamshri Realty Ltd has a market capitalization of 57.00 Cr, classifying it as a Micro Cap company, with recent net sales of 7.11 Cr and a net profit loss of 0.19 Cr over the last four quarters.

As of 10th June, <BR><BR>Market Cap: Jamshri Realty Ltd has a market capitalization of 57.00 Cr, classifying it as a Micro Cap company.<BR><BR>Recent Quarterly Performance: The sum of Net Sales for the latest 4 quarters is 7.11 Cr, while the sum of Net Profit for the same period reflects a loss of 0.19 Cr.<BR><BR>Balance Sheet Snapshot: The reporting period for the balance sheet is March 2025. Shareholder's Funds stand at a loss of 5.18 Cr, and Total Assets are valued at 52.29 Cr.

View full answer

Who are in the management team of Jamshri Realty?

11-Jun-2026

The management team of Jamshri Realty includes Prem Ratan Damani (Managing Director), Rajesh Damani (Executive Chairman), and several Independent and Non-Executive Directors: Kiranbhai J Shah, S K Somany, Balkishan Mohta, Rekha Thirani, Ananad Ashvin Dalal, Umesh Marathe, and Pradeep Kumar Singhal. They are responsible for guiding the company's strategic direction and operations.

The management team of Jamshri Realty includes the following individuals:<BR><BR>1. **Prem Ratan Damani** - Managing Director<BR>2. **Rajesh Damani** - Executive Chairman<BR>3. **Kiranbhai J Shah** - Independent Director<BR>4. **S K Somany** - Independent Director<BR>5. **Balkishan Mohta** - Independent Director<BR>6. **Rekha Thirani** - Non Executive Director<BR>7. **Ananad Ashvin Dalal** - Non Executive Director<BR>8. **Umesh Marathe** - Non Executive Director<BR>9. **Pradeep Kumar Singhal** - Non Executive Director<BR><BR>This team plays a crucial role in guiding the company's strategic direction and operations.

View full answer

Who are the peers of the Jamshri Realty?

11-Jun-2026

Jamshri Realty's peers include Skyline Millars, Rodium Realty, Modipon, Dhansafal Fin, Grovy India, Prime Property, Victoria Mills, Sam Industries, Ansal Housing, and Ansal Properties. Modipon has the highest 1-year return at 13.34%, while Jamshri Realty's return is -40.65%.

Peers: The peers of Jamshri Realty are Skyline Millars, Rodium Realty, Modipon, Dhansafal Fin, Grovy India, Prime Property, Victoria Mills, Sam Industries, Ansal Housing, and Ansal Properties.<BR><BR>Quality Snapshot: Below Average management risk is observed at Skyline Millars, Rodium Realty, Dhansafal Fin, Grovy India, Prime Property, Sam Industries, and Ansal Housing, while Average management risk is found at Victoria Mills. Modipon does not qualify for management risk assessment. Growth is Excellent at Rodium Realty, Good at Dhansafal Fin, Grovy India, Prime Property, and Victoria Mills, while Below Average growth is seen at Skyline Millars, Sam Industries, and Ansal Housing. Jamshri Realty and Modipon do not qualify for growth assessment. Capital Structure is Excellent at Grovy India and Prime Property, Good at Victoria Mills, and Below Average at Skyline Millars, Rodium Realty, Dhansafal Fin, Sam Industries, Ansal Housing, and Ansal Properties, with Jamshri Realty and Modipon not qualifying.<BR><BR>Return Snapshot: Modipon has the highest 1-year return at 13.34%, while Ansal Housing has the lowest at -47.38%, with Jamshri Realty's 1-year return at -40.65%, indicating it is better than Ansal Housing but worse than Modipon. Additionally, the six-month return is negative for Skyline Millars, Dhansafal Fin, Grovy India, Victoria Mills, Sam Industries, and Ansal Housing.

View full answer

What does Jamshri Realty do?

10-Jun-2026

Jamshri Realty Ltd, a micro-cap company, operates in the real estate and hospitality sector after transitioning from textile manufacturing in 2018. As of March 2026, it reported net sales of 2 Cr and a market cap of INR 57 Cr.

Overview: <BR>Jamshri Realty Ltd operates in the real estate and hospitality sector and is categorized as a micro-cap company.<BR><BR>History: <BR>Jamshri Realty Limited was initially incorporated as Jamshri Ranjitsinghji Spinning & Weaving Mills Limited on August 15, 1907. The company underwent a significant transition in 2018 when it permanently closed its textile manufacturing operations and shifted its focus to the service industry, primarily in real estate and hospitality. The most recent quarterly results reported net sales and net profit for the period ending March 2026.<BR><BR>Financial Snapshot: <BR>Net Sales: 2 Cr (Quarterly Results - Mar 2026) <BR>Net Profit: 0 Cr (Quarterly Results - Mar 2026) <BR>Market Cap: INR 57 Cr (Micro Cap)<BR><BR>Key Metrics: <BR>P/E: N/A <BR>Industry P/E: 23 <BR>Dividend Yield: 0.00% <BR>Debt Equity: -9.60 <BR>Return on Equity: 2.52% <BR>Price to Book: -10.83<BR><BR>Contact Details: <BR>Address: Fatehchand Damani Nagar, Station Road Solapur Maharashtra : 413001 <BR>Tel: 91-022-43152400 <BR>Email: jammill1907@gmail.com <BR>Website: http://www.jamshri.in

View full answer

Should I buy, sell or hold Jamshri Realty Ltd?

23-May-2026

How has been the historical performance of Jamshri Realty?

06-Nov-2025

Jamshri Realty's net sales grew from 1.52 crore in March 2020 to 7.03 crore in March 2025, with an improved operating profit margin of 9.67%, though profit before tax remained negative at -1.05 crore. Total liabilities and assets both increased to 52.29 crore, while cash flow from operating activities turned positive at 1.00 crore in March 2025.

Answer:<BR>The historical performance of Jamshri Realty shows a significant increase in net sales over the years, rising from 1.52 crore in March 2020 to 7.03 crore in March 2025. Total operating income followed a similar trend, reaching 7.03 crore in March 2025, compared to 1.52 crore in March 2020. Despite this growth in revenue, the company has faced challenges with profitability, as indicated by the operating profit margin, which improved to 9.67% in March 2025 from a negative 65.79% in March 2020. However, the profit before tax remained negative at -1.05 crore in March 2025, although it was an improvement from -4.00 crore in March 2023. The company's total liabilities increased from 27.93 crore in March 2020 to 52.29 crore in March 2025, while total assets also rose from 27.93 crore to 52.29 crore during the same period. Cash flow from operating activities turned positive at 1.00 crore in March 2025, contrasting with negative cash flows in previous years.<BR><BR>Breakdown:<BR>Jamshri Realty's financial trajectory has shown a notable increase in net sales, climbing from 1.52 crore in March 2020 to 7.03 crore in March 2025, reflecting a strong upward trend in revenue generation. Total operating income mirrored this growth, reaching 7.03 crore in March 2025. Despite the increase in sales, profitability has been a concern, with the operating profit margin improving to 9.67% in March 2025 from a significantly negative figure of -65.79% in March 2020, yet the profit before tax remained negative at -1.05 crore. The company's total liabilities have escalated from 27.93 crore to 52.29 crore, indicating a growing debt burden, while total assets increased correspondingly from 27.93 crore to 52.29 crore. In terms of cash flow, the company achieved a positive cash flow from operating activities of 1.00 crore in March 2025, a turnaround from the negative cash flows observed in prior years.

View full answer

Who are the top shareholders of the Jamshri Realty?

17-Jul-2025

The top shareholders of Jamshri Realty are Bimladevi Premratan Damani with 49.7%, and Swati Surajratan Agrawal, the largest public shareholder, with 5.3%. Individual investors own 27.25%, with no holdings from mutual funds or foreign institutional investors.

The top shareholders of Jamshri Realty include Bimladevi Premratan Damani, who holds the largest stake at 49.7%. The highest public shareholder is Swati Surajratan Agrawal, with a holding of 5.3%. Additionally, individual investors collectively own 27.25% of the company. There are currently no holdings from mutual funds or foreign institutional investors.

View full answer

Is Jamshri Realty overvalued or undervalued?

09-Jun-2025

As of April 25, 2023, Jamshri Realty is classified as risky and overvalued due to troubling financial ratios, including a PE ratio of -60.19 and negative ROCE of -3.19%, despite outperforming the Sensex with a 32.48% return over the past year.

As of 25 April 2023, Jamshri Realty's valuation grade has moved from does not qualify to risky, indicating significant concerns regarding its financial health. The company is currently deemed overvalued, particularly given its troubling headline ratios, such as a PE ratio of -60.19, an EV to EBITDA of 130.79, and a negative ROCE of -3.19%. These figures suggest that the company is struggling to generate positive earnings relative to its valuation.<BR><BR>In comparison to its peers, Jamshri Realty's valuation metrics starkly contrast with those of K P R Mill Ltd, which has a PE ratio of 47.51, and Trident, with a PE of 42.6, both of which are significantly more favorable. Additionally, the company's recent stock performance has outpaced the Sensex over the past year, returning 32.48% compared to the Sensex's 7.64%, but this does not mitigate the underlying valuation concerns. Overall, the combination of negative ratios and a risky classification underscores the overvaluation of Jamshri Realty in the current market context.

View full answer

What is the technical trend for Jamshri Realty?

09-Jun-2025

As of June 6, 2025, Jamshri Realty's technical trend is neutral, with weekly indicators showing mild bullishness and monthly indicators reflecting bearish pressures, resulting in mixed signals overall.

As of 6 June 2025, the technical trend for Jamshri Realty has changed from mildly bearish to sideways. The weekly MACD is mildly bullish, while the monthly MACD is mildly bearish, indicating mixed signals across time frames. The Bollinger Bands are bullish on both weekly and monthly charts, suggesting potential upward momentum. However, daily moving averages are mildly bearish, which could limit short-term gains. The KST and Dow Theory both show a mildly bullish stance on the weekly basis but are bearish on the monthly. Overall, the current technical stance is neutral, with strength driven by weekly indicators showing bullish tendencies, while monthly indicators reflect bearish pressures.

View full answer

Has Jamshri Realty declared dividend?

06-Jun-2025

No Dividend History Available

iScoreScore
Click here to find our call on this stock
Strong Sell
Sell
Hold
Buy
Strong Buy

Dashboard

1

With a Negative Book Value, the company has a Weak Long Term Fundamental Strength

  • Poor long term growth as Net Sales has grown by an annual rate of 30.34% and Operating profit at 0% over the last 5 years
  • The company has a negative book value of Rs 5.16 crore
2

Flat results in Jun 26

 
3

Risky - Negative Book Value

4

Underperformed the market in the last 1 year

stock-summaryMojo Parameters

Mojo Parameters

Loading Valuation Snapshot...

Stock DNA

stock-summary
Industry

Realty

stock-summary
Market cap

INR 54 Cr (Micro Cap)

stock-summary
P/E

NA (Loss Making)

stock-summary
Industry P/E

25

stock-summary
Dividend Yield

0.00%

stock-summary
Debt Equity

-9.60

stock-summary
Return on Equity

1.94%

stock-summary
Price to Book

-10.29

Revenue and Profits:
Net Sales:
2 Cr
(Quarterly Results - Jun 2026)
Net Profit:
0 Cr
stock-summaryTotal Returns
Total Returns (Price + Dividend) stock-summary
Dividend Yield (0%)
TimePeriod
Price Return
Dividend Return
Total Return
3 Months
-5.4%
0%
-5.4%
6 Months
-5.39%
0%
-5.39%
1 Year
-30.36%
0%
-30.36%
2 Years
-62.69%
0%
-62.69%
3 Years
80.26%
0%
80.26%
4 Years
0%
0%
0.0%
5 Years
0%
0%
0.0%

Jamshri Realty for the last several years.

Risk Adjusted Returns v/s stock-summary
Returns Beta
Icon
Beta has not been calculated since enough price history is not available
stock-summaryNews & Corporate Actions

News

Announcements stock-summary

Intimation Of Book Closure Pursuant To Section 91 Of The Companies Act 2013 And Regulation 42 Of The SEBI (Listing Obligations And Disclosure Requirements) Regulations 2015.

04-Aug-2026 | Source : BSE

Notice is hereby given pursuant to section 91 of the Companies Act 2013 and regulation 42 of SEBI ( Listing Obligations and Disclosure Requirements) Regulations 2015. (Copy attached)

Announcement under Regulation 30 (LODR)-Newspaper Publication

04-Aug-2026 | Source : BSE

Submission of Newspaper Notice of Annual General Meeting Pursuant to Regulation 30 (LODR) attached

Announcement under Regulation 30 (LODR)-Newspaper Publication

04-Aug-2026 | Source : BSE

Submission of Newspaper Notice of Annual General Meeting Pursuant to Regulation 30 (LODR) attached

Corporate Actions stock-summary

stock-summary
BOARD MEETING

No Upcoming Board Meetings

stock-summary
DIVIDEND

No Dividend history available

stock-summary
SPLITS

Jamshri Realty Ltd has announced 10:1000 stock split, ex-date: 16 Aug 24

stock-summary
BONUS

No Bonus history available

stock-summary
RIGHTS

Jamshri Realty Ltd has announced 1:1 rights issue, ex-date: 04 Feb 09

stock-summaryKey Factors

Quality key factors stock-summary

Factor
Value
Sales Growth (5y)
30.34%
EBIT Growth (5y)
20.77%
EBIT to Interest (avg)
0
Debt to EBITDA (avg)
Negative Net Debt
Net Debt to Equity (avg)
-9.60
Sales to Capital Employed (avg)
0
Tax Ratio
Tax Ratio is Negative%
Dividend Payout Ratio
0
Pledged Shares
0
Institutional Holding
0.35%
ROCE (avg)
-5.87%
ROE (avg)
0

Valuation key factors

Factor
Value
P/E Ratio
NA (Loss Making)
Industry P/E
25
Price to Book Value
-10.26
EV to EBIT
89.15
EV to EBITDA
47.68
EV to Capital Employed
2.31
EV to Sales
14.73
PEG Ratio
NA
Dividend Yield
NA
ROCE (Latest)
1.10%
ROE (Latest)
Negative BV

Technicals key factors

Indicator
Weekly
Monthly
MACD
Mildly Bullish
Bearish
RSI
No Signal
No Signal
Bollinger Bands
Bearish
Bearish
Moving Averages
Bearish (Daily)
KST
Mildly Bullish
Bearish
Dow Theory
Mildly Bearish
Mildly Bearish
stock-summary Technical Indicator Scale: Bearish, Mildly Bearish, Sideways, Mildly Bullish, Bullish  Turned 
stock-summaryShareholding
Shareholding Snapshot : Jun 2026stock-summary
Shareholding Compare (%holding) stock-summary
Majority shareholders

Promoters

Pledged Promoter Holdings

None

Mutual Funds

Held by 1 Schemes (0.0%)

FIIs

Held by 0 FIIs

Promoter with highest holding

Bimladevi Premratan Damani (44.36%)

Highest Public shareholder

Swati Surajratan Agrawal (5.3%)

Individual Investors Holdings

28.57%

stock-summaryFinancial
[
  {
    "link": "quarterly",
    "btn_text": "All Quarterly Results",
    "header": "Quarterly Results Snapshot (Standalone) - Jun'26 - QoQ",
    "rhs": [
      {
        "prefix": "Net Sales ",
        "suffix": "QoQ Growth in quarter ended Jun 2026 is 11.18% vs -16.48% in Mar 2026",
        "dir": 1
      },
      {
        "prefix": "Standalone Net Profit ",
        "suffix": "QoQ Growth in quarter ended Jun 2026 is 190.00% vs 0.00% in Mar 2026",
        "dir": 1
      }
    ],
    "table": {
      "header": [
        "Jun'26",
        "Mar'26",
        "Change(%)"
      ],
      "body": [
        {
          "field": "Net Sales",
          "val1": "1.69",
          "val2": "1.52",
          "chgp": "11.18%",
          "chgp_class": "positive"
        },
        {
          "field": "Operating Profit (PBDIT) excl Other Income",
          "val1": "0.66",
          "val2": "0.26",
          "chgp": "153.85%",
          "chgp_class": "positive"
        },
        {
          "field": "Interest",
          "val1": "0.81",
          "val2": "0.88",
          "chgp": "-7.95%",
          "chgp_class": "positive"
        },
        {
          "field": "Exceptional Items",
          "val1": "0.00",
          "val2": "0.10",
          "chgp": "-100.00%",
          "chgp_class": "negative"
        },
        {
          "field": "Standalone Net Profit",
          "val1": "0.18",
          "val2": "-0.20",
          "chgp": "190.00%",
          "chgp_class": "positive"
        },
        {
          "field": "Operating Profit Margin (Excl OI)",
          "val1": "39.05%",
          "val2": "17.11%",
          "chgp": "21.94%",
          "chgp_class": "positive"
        }
      ]
    }
  },
  {
    "link": "half-yearly",
    "btn_text": "All Half Yearly Results",
    "header": "Half Yearly Results Snapshot (Standalone) - Sep'25",
    "rhs": [
      {
        "prefix": "Net Sales ",
        "suffix": " Growth in half year ended Sep 2025 is 8.99% vs 49.35% in Sep 2024",
        "dir": -1
      },
      {
        "prefix": "Standalone Net Profit ",
        "suffix": " Growth in half year ended Sep 2025 is 102.63% vs 85.82% in Sep 2024",
        "dir": 1
      }
    ],
    "table": {
      "header": [
        "Sep'25",
        "Sep'24",
        "Change(%)"
      ],
      "body": [
        {
          "field": "Net Sales",
          "val1": "3.76",
          "val2": "3.45",
          "chgp": "8.99%",
          "chgp_class": "positive"
        },
        {
          "field": "Operating Profit (PBDIT) excl Other Income",
          "val1": "1.10",
          "val2": "0.24",
          "chgp": "358.33%",
          "chgp_class": "positive"
        },
        {
          "field": "Interest",
          "val1": "1.34",
          "val2": "1.41",
          "chgp": "-4.96%",
          "chgp_class": "positive"
        },
        {
          "field": "Exceptional Items",
          "val1": "-0.10",
          "val2": "0.22",
          "chgp": "-145.45%",
          "chgp_class": "negative"
        },
        {
          "field": "Standalone Net Profit",
          "val1": "0.01",
          "val2": "-0.38",
          "chgp": "102.63%",
          "chgp_class": "positive"
        },
        {
          "field": "Operating Profit Margin (Excl OI)",
          "val1": "29.26%",
          "val2": "6.96%",
          "chgp": "22.30%",
          "chgp_class": "positive"
        }
      ]
    }
  },
  {
    "link": "nine-monthly",
    "btn_text": "All Nine Monthly Results",
    "header": "Nine Monthly Results Snapshot (Standalone) - Dec'25",
    "rhs": [
      {
        "prefix": "Net Sales ",
        "suffix": "YoY Growth in nine months ended Dec 2025 is 4.49% vs 40.53% in Dec 2024",
        "dir": -1
      },
      {
        "prefix": "Standalone Net Profit ",
        "suffix": "YoY Growth in nine months ended Dec 2025 is 101.30% vs 75.00% in Dec 2024",
        "dir": 1
      }
    ],
    "table": {
      "header": [
        "Dec'25",
        "Dec'24",
        "Change(%)"
      ],
      "body": [
        {
          "field": "Net Sales",
          "val1": "5.58",
          "val2": "5.34",
          "chgp": "4.49%",
          "chgp_class": "positive"
        },
        {
          "field": "Operating Profit (PBDIT) excl Other Income",
          "val1": "1.79",
          "val2": "0.56",
          "chgp": "219.64%",
          "chgp_class": "positive"
        },
        {
          "field": "Interest",
          "val1": "2.03",
          "val2": "2.07",
          "chgp": "-1.93%",
          "chgp_class": "positive"
        },
        {
          "field": "Exceptional Items",
          "val1": "-0.15",
          "val2": "0.17",
          "chgp": "-188.24%",
          "chgp_class": "negative"
        },
        {
          "field": "Standalone Net Profit",
          "val1": "0.01",
          "val2": "-0.77",
          "chgp": "101.30%",
          "chgp_class": "positive"
        },
        {
          "field": "Operating Profit Margin (Excl OI)",
          "val1": "32.08%",
          "val2": "10.49%",
          "chgp": "21.59%",
          "chgp_class": "positive"
        }
      ]
    }
  },
  {
    "link": "annual",
    "btn_text": "All Annual Results",
    "header": "Annual Results Snapshot (Standalone) - Mar'26",
    "rhs": [
      {
        "prefix": "Net Sales ",
        "suffix": "YoY Growth in year ended Mar 2026 is 1.28% vs 30.43% in Mar 2025",
        "dir": -1
      },
      {
        "prefix": "Standalone Net Profit ",
        "suffix": "YoY Growth in year ended Mar 2026 is 84.68% vs 63.53% in Mar 2025",
        "dir": 1
      }
    ],
    "table": {
      "header": [
        "Mar'26",
        "Mar'25",
        "Change(%)"
      ],
      "body": [
        {
          "field": "Net Sales",
          "val1": "7.12",
          "val2": "7.03",
          "chgp": "1.28%",
          "chgp_class": "positive"
        },
        {
          "field": "Operating Profit (PBDIT) excl Other Income",
          "val1": "2.05",
          "val2": "0.68",
          "chgp": "201.47%",
          "chgp_class": "positive"
        },
        {
          "field": "Interest",
          "val1": "2.90",
          "val2": "2.73",
          "chgp": "6.23%",
          "chgp_class": "negative"
        },
        {
          "field": "Exceptional Items",
          "val1": "-0.05",
          "val2": "0.13",
          "chgp": "-138.46%",
          "chgp_class": "negative"
        },
        {
          "field": "Standalone Net Profit",
          "val1": "-0.19",
          "val2": "-1.24",
          "chgp": "84.68%",
          "chgp_class": "positive"
        },
        {
          "field": "Operating Profit Margin (Excl OI)",
          "val1": "28.79%",
          "val2": "9.67%",
          "chgp": "19.12%",
          "chgp_class": "positive"
        }
      ]
    }
  }
]

Quarterly Results Snapshot (Standalone) - Jun'26 - QoQstock-summary

Jun'26
Mar'26
Change(%)
Net Sales
1.69
1.52
11.18%
Operating Profit (PBDIT) excl Other Income
0.66
0.26
153.85%
Interest
0.81
0.88
-7.95%
Exceptional Items
0.00
0.10
-100.00%
Standalone Net Profit
0.18
-0.20
190.00%
Operating Profit Margin (Excl OI)
39.05%
17.11%
21.94%
Values in Rs Cr.
Direction Arrows
Net Sales

QoQ Growth in quarter ended Jun 2026 is 11.18% vs -16.48% in Mar 2026

Direction Arrows
Standalone Net Profit

QoQ Growth in quarter ended Jun 2026 is 190.00% vs 0.00% in Mar 2026

Half Yearly Results Snapshot (Standalone) - Sep'25stock-summary

Sep'25
Sep'24
Change(%)
Net Sales
3.76
3.45
8.99%
Operating Profit (PBDIT) excl Other Income
1.10
0.24
358.33%
Interest
1.34
1.41
-4.96%
Exceptional Items
-0.10
0.22
-145.45%
Standalone Net Profit
0.01
-0.38
102.63%
Operating Profit Margin (Excl OI)
29.26%
6.96%
22.30%
Values in Rs Cr.
Direction Arrows
Net Sales

Growth in half year ended Sep 2025 is 8.99% vs 49.35% in Sep 2024

Direction Arrows
Standalone Net Profit

Growth in half year ended Sep 2025 is 102.63% vs 85.82% in Sep 2024

Nine Monthly Results Snapshot (Standalone) - Dec'25stock-summary

Dec'25
Dec'24
Change(%)
Net Sales
5.58
5.34
4.49%
Operating Profit (PBDIT) excl Other Income
1.79
0.56
219.64%
Interest
2.03
2.07
-1.93%
Exceptional Items
-0.15
0.17
-188.24%
Standalone Net Profit
0.01
-0.77
101.30%
Operating Profit Margin (Excl OI)
32.08%
10.49%
21.59%
Values in Rs Cr.
Direction Arrows
Net Sales

YoY Growth in nine months ended Dec 2025 is 4.49% vs 40.53% in Dec 2024

Direction Arrows
Standalone Net Profit

YoY Growth in nine months ended Dec 2025 is 101.30% vs 75.00% in Dec 2024

Annual Results Snapshot (Standalone) - Mar'26stock-summary

Mar'26
Mar'25
Change(%)
Net Sales
7.12
7.03
1.28%
Operating Profit (PBDIT) excl Other Income
2.05
0.68
201.47%
Interest
2.90
2.73
6.23%
Exceptional Items
-0.05
0.13
-138.46%
Standalone Net Profit
-0.19
-1.24
84.68%
Operating Profit Margin (Excl OI)
28.79%
9.67%
19.12%
Values in Rs Cr.
Direction Arrows
Net Sales

YoY Growth in year ended Mar 2026 is 1.28% vs 30.43% in Mar 2025

Direction Arrows
Standalone Net Profit

YoY Growth in year ended Mar 2026 is 84.68% vs 63.53% in Mar 2025

stock-summaryCompany CV
About Jamshri Realty Ltd stock-summary
stock-summary
Jamshri Realty Ltd
Micro Cap
Realty
Jamshri Realty Limited was initially incorporated as Jamshri Ranjitsinghji Spinning & Weaving Mills Limited on August 15, 1907. In 1955, controlling interests were acquired by the Damani family. After the permanent closure of the textile manufacturing operations on 1st November 2018, the Company changed its business from manufacturing to service industry mainly in real estate and hospitality business.
Company Coordinates stock-summary
Company Details
Fatehchand Damani Nagar, Station Road Solapur Maharashtra : 413001
stock-summary
Tel: 91-022-43152400
stock-summary
jammill1907@gmail.com
Registrar Details
Computech Sharecap Ltd , 147 M G Road , Opp: Jahangir Art Gallary, Fort, Mumbai