
Compare Jana Small Finan with Similar Stocks
Dashboard
Strong lending practices with low Gross NPA ratio of 2.46%
Healthy long term growth as Net Interest Income (ex other income) has grown by an annual rate of 20.86% and Net profit at 78.40%
The company has declared positive results in Mar'2026 after 5 consecutive negative quarters
With ROA of 0.7, it has a Fair valuation with a 1.1 Price to Book Value
High Institutional Holdings at 20.58%
Total Returns (Price + Dividend) 
Jana Small Finan for the last several years.
Risk Adjusted Returns v/s
Returns Beta

News

Jana Small Finance Bank Ltd is Rated Buy
Jana Small Finance Bank Ltd is rated Buy by MarketsMOJO, with this rating last updated on 4 June 2026. While the rating was revised on that date, the analysis and financial metrics discussed here reflect the stock’s current position as of 10 June 2026, providing investors with the most up-to-date view of the company’s fundamentals, returns, and market standing.
Read full news article
Jana Small Finance Bank Ltd Technical Momentum Shifts Signal Mild Bullish Outlook
Jana Small Finance Bank Ltd has exhibited a notable shift in its technical momentum, moving from a sideways trend to a mildly bullish stance. This change is underscored by a combination of technical indicators including MACD, Bollinger Bands, and On-Balance Volume (OBV), suggesting a cautiously optimistic outlook despite a recent slight dip in price.
Read full news article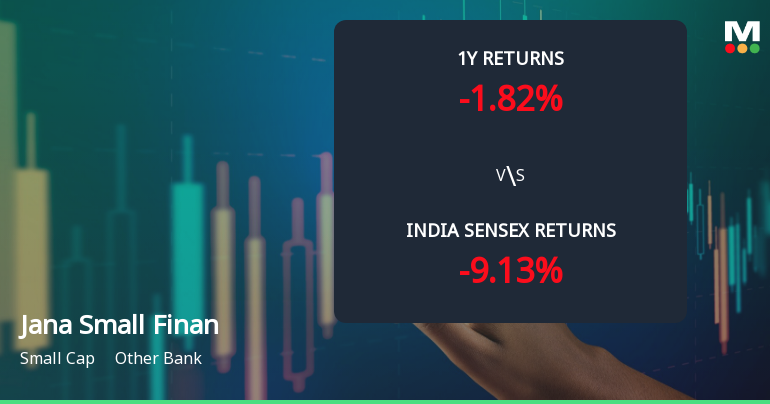
Jana Small Finance Bank Ltd Technical Momentum Shifts Amid Sideways Trend
Jana Small Finance Bank Ltd has experienced a notable shift in its technical momentum, transitioning from a mildly bullish stance to a sideways trend. Despite a recent day decline of 1.96%, the stock’s year-to-date return of 14.18% significantly outperforms the Sensex’s negative 12.85%, signalling resilience amid broader market weakness. This article analyses the latest technical indicators, price momentum, and moving averages to provide a comprehensive view of the stock’s current positioning and outlook.
Read full news article Announcements
Intimation Regarding Modifications To The Notice Of Extra-Ordinary General Meeting Pursuant To Observations Received From National Stock Exchange Of India Limited
05-Jun-2026 | Source : BSEPlease find attached disclosure
Announcement under Regulation 30 (LODR)-Analyst / Investor Meet - Intimation
05-Jun-2026 | Source : BSEPlease find attached intimation regarding investor meeting.
Recognition Of Jana Small Finance Banks CSR Initiatives By The Government Of Haryana
30-May-2026 | Source : BSEPlease find attached intimation on the captioned subject
Corporate Actions

No Upcoming Board Meetings

No Dividend history available

No Splits history available

No Bonus history available

No Rights history available
Quality key factors
Valuation key factors
Technicals key factors
 Technical Indicator Scale: Bearish, Mildly Bearish, Sideways, Mildly Bullish, Bullish Turned
 Shareholding Snapshot : Mar 2026
Shareholding Compare (%holding)
Non Institution
None
Held by 7 Schemes (1.92%)
Held by 39 FIIs (4.31%)
Jana Holdings Limited (21.85%)
Tpg Asia Vi Sf Pte. Ltd. (8.11%)
24.05%
Quarterly Results Snapshot (Standalone) - Mar'26 - QoQ

QoQ Growth in quarter ended Mar 2026 is 5.17% vs 5.27% in Dec 2025

QoQ Growth in quarter ended Mar 2026 is 1,342.93% vs -87.08% in Dec 2025
Half Yearly Results Snapshot (Standalone) - Sep'25
Growth in half year ended Sep 2025 is 9.59% vs 25.17% in Sep 2024
Growth in half year ended Sep 2025 is -33.81% vs 25.35% in Sep 2024
Nine Monthly Results Snapshot (Standalone) - Dec'25
YoY Growth in nine months ended Dec 2025 is 11.96% vs 20.97% in Dec 2024
YoY Growth in nine months ended Dec 2025 is -50.62% vs 8.65% in Dec 2024
Annual Results Snapshot (Standalone) - Mar'26
YoY Growth in year ended Mar 2026 is 14.59% vs 16.38% in Mar 2025
YoY Growth in year ended Mar 2026 is -34.90% vs -25.11% in Mar 2025
About Jana Small Finance Bank Ltd

Company Coordinates


