Jash Engineering

  • Market Cap: Small Cap
  • Industry: Industrial Manufacturing
  • ISIN: INE039O01029
  • NSEID: JASH
  • BSEID: 544402
INR
366.40
-8.8 (-2.35%)
BSENSE

Mar 13

BSE+NSE Vol: 1.55 lacs

  • Price Points
  • Score
  • Mojo Parameters
  • Total Return
  • News and Corporate Actions
  • Key factors
  • Shareholding
  • Financials
  • CompanyCV
stock-summaryPrice Point
High/Low

1Day

52 Week

Valuation
Technical
Day's Volume

CASH

1.55 lacs (-15.47%) Volume

Shareholding (Dec 2025)

FII

2.00%

Held by 35 FIIs

DII

0.49%

Held by 0 DIIs

Promoter

43.44%

What does Jash Engineering do?

06-Jun-2025

Jash Engineering Ltd, established in 1973 and publicly listed since 1994, operates in industrial manufacturing with a market cap of Rs 3,526 Cr. As of March 2025, it reported net sales of 300 Cr and a net profit of 36 Cr, with a P/E ratio of 40.00.

Overview: <BR>Jash Engineering Ltd is a company operating in the industrial manufacturing sector and is categorized as a small-cap entity.<BR><BR>History: <BR>Jash Engineering Limited was incorporated in 1973 as "Jash Engineering Industries Private Limited" and later changed its name to "Jash Engineering Private Limited" in 1976. The company became a public limited company in 1994, adopting the name "Jash Engineering Limited." The latest quarterly results reported net sales and net profit for March 2025.<BR><BR>Financial Snapshot: <BR>Net Sales: 300 Cr (Quarterly Results - Mar 2025) <BR>Net Profit: 36 Cr (Quarterly Results - Mar 2025) <BR>Market Cap: Rs 3,526 Cr (Small Cap)<BR><BR>Key Metrics: <BR>P/E: 40.00 <BR>Industry P/E: 38 <BR>Dividend Yield: 0.40% <BR>Debt Equity: -0.03 <BR>Return on Equity: 20.25% <BR>Price to Book: 8.12 <BR><BR>Contact Details: <BR>Address: 31 Sector-C Industrial Area, Sanwer Road Indore Madhya Pradesh : 452015 <BR>Tel: 91-731-2720143/2721143/4232900 <BR>Fax: 91-731-2720499 <BR>Website: http://www.jashindia.com

View full answer

When is the next results date for Jash Engineering?

06-Jun-2025

No Upcoming Board Meetings

Has Jash Engineering declared dividend?

30-Apr-2025

Yes, Jash Engineering Ltd has declared a 40% dividend, amounting to 0.8 per share, with an ex-date of March 10, 2025. The company has shown strong total returns over various periods, including a total return of 2185.85% over the last 5 years.

Jash Engineering Ltd has declared a 40% dividend.<BR><BR>Dividend Details:<BR>- Percentage announced: 40%<BR>- Amount per share: 0.8<BR>- Ex-date: Mar-10-2025<BR><BR>Dividend Yield: 0.38%.<BR><BR>Total Returns by Period:<BR>In the 6-month period, Jash Engineering experienced a price return of 16.75%, a dividend return of 0.16%, resulting in a total return of 16.91%.<BR><BR>Over the 1-year period, the company achieved a price return of 43.84%, a dividend return of 1.97%, leading to a total return of 45.81%.<BR><BR>For the 2-year period, the price return was 209.09%, with a dividend return of 6.03%, culminating in a total return of 215.12%.<BR><BR>In the 3-year period, Jash Engineering saw a price return of 340.62% and a dividend return of 9.59%, resulting in a total return of 350.21%.<BR><BR>During the 4-year period, the company recorded a price return of 673.85%, a dividend return of 13.85%, which led to a total return of 687.7%.<BR><BR>Finally, in the 5-year period, Jash Engineering achieved a remarkable price return of 2118.42%, with a dividend return of 67.43%, resulting in an impressive total return of 2185.85%.<BR><BR>Overall, Jash Engineering's declaration of a dividend alongside significant total returns across various periods indicates a strong performance and commitment to returning value to shareholders.

View full answer

Who are the peers of the Jash Engineering?

16-Jul-2025

Jash Engineering's peers include WPIL, Shanthi Gears, Cyient DLM, Standard Glass, Pitti Engg., Centum Electron, Pennar Industrie, Windsor Machines, and Honda India. Management risk varies from excellent at Shanthi Gears and Honda India to average at Jash Engineering, with growth and capital structure ratings also differing among peers.

Peers: The peers of Jash Engineering are WPIL, Shanthi Gears, Cyient DLM, Standard Glass, Pitti Engg., Centum Electron, Pennar Industrie, Windsor Machines, Honda India.<BR><BR>Quality Snapshot: Excellent management risk is observed at Shanthi Gears and Honda India, while Average management risk is found at WPIL, Cyient DLM, Standard Glass, Jash Engineering, Pitti Engg., Centum Electron, and Pennar Industrie, and the rest. Good growth is noted at Shanthi Gears and Pitti Engg., while Average growth is seen at Jash Engineering, WPIL, and the rest, and Below Average growth is present at Cyient DLM, Standard Glass, Centum Electron, and Pennar Industrie. Excellent capital structure is held by WPIL, Shanthi Gears, and Standard Glass, while Good capital structure is noted at Jash Engineering and Windsor Machines, and Average capital structure is found at Pitti Engg., with Below Average capital structure at Centum Electron and Pennar Industrie.<BR><BR>Return Snapshot: The peer with the highest 1-year return is Windsor Machines at 121.95%, while Cyient DLM has the lowest at -38.19%. Jash Engineering's 1-year return is not available for comparison. Additionally, peers with negative six-month returns include WPIL, Cyient DLM, Pitti Engg., and Honda India.

View full answer

Who are in the management team of Jash Engineering?

16-Jul-2025

As of March 2018, the management team of Jash Engineering includes Laxminandan Amin (Chairman & Managing Director), Pratik Patel (Managing Director), and several non-executive independent directors, along with Tushar Kharpade as Company Secretary. Each member contributes to the company's governance and management.

As of March 2018, the management team of Jash Engineering includes:<BR><BR>1. Laxminandan Amin - Chairman & Managing Director<BR>2. Pratik Patel - Managing Director<BR>3. Axel Schutte - Non Executive Director<BR>4. Brij Mohan Maheshwari - Non Executive Independent Director<BR>5. Durgalal Tuljaram Manwani - Non Executive Independent Director<BR>6. Sunil Choksi - Non Executive Independent Director<BR>7. Sunita Kishnani - Non Executive Independent Director<BR>8. Tushar Kharpade - Company Secretary<BR>9. Vishwapti Trivedi - Non Executive Independent Director<BR><BR>Each member plays a distinct role in the governance and management of the company.

View full answer

Who are the top shareholders of the Jash Engineering?

17-Jul-2025

The top shareholders of Jash Engineering include Pratik Patel with 11.22%, a significant individual investor base holding 39.1%, and Axel Schutte as the highest public shareholder at 3.97%. Additionally, 34 Foreign Institutional Investors hold 1.96%, with minimal mutual fund presence at 0.04%, and there are no pledged promoter holdings.

The top shareholders of Jash Engineering include Pratik Patel, who is the promoter with the highest holding at 11.22%. The company also has a significant individual investor base, holding 39.1% of the shares. Additionally, Axel Schutte is noted as the highest public shareholder with a 3.97% stake. In terms of institutional holdings, there are 34 Foreign Institutional Investors (FIIs) that collectively hold 1.96%, and there is a small mutual fund presence with one scheme holding 0.04%. There are no pledged promoter holdings reported.

View full answer

How big is Jash Engineering?

24-Jul-2025

As of 24th July, Jash Engineering Ltd has a market capitalization of 3,800.00 Cr, with recent Net Sales of 735.19 Cr and a Net Profit of 87.70 Cr. The company reported Shareholder's Funds of 351.21 Cr and Total Assets of 598.02 Cr for the annual period ending March 2024.

As of 24th July, Jash Engineering Ltd has a market capitalization of 3,800.00 Cr, classifying it as a Small Cap company.<BR><BR>In the latest four quarters, Jash Engineering reported Net Sales of 735.19 Cr and a Net Profit of 87.70 Cr.<BR><BR>For the latest annual period ending March 2024, the company had Shareholder's Funds of 351.21 Cr and Total Assets amounting to 598.02 Cr.

View full answer

How has been the historical performance of Jash Engineering?

17-Nov-2025

Jash Engineering has shown consistent growth in net sales and profitability, with net sales increasing from INR 248.33 crore in March 2019 to INR 735.19 crore in March 2025, and profit after tax rising from INR 8.54 crore to INR 87.03 crore in the same period, despite some fluctuations in cash flow. Total assets grew from INR 284.56 crore in March 2020 to INR 738.69 crore in March 2025.

Answer:<BR>The historical performance of Jash Engineering shows a consistent upward trend in net sales and profitability over the past several years.<BR><BR>Breakdown:<BR>Jash Engineering's net sales have increased significantly from INR 248.33 crore in March 2019 to INR 735.19 crore in March 2025, reflecting a strong growth trajectory. The total operating income also rose in tandem, reaching INR 735.19 crore in March 2025, up from INR 248.33 crore in March 2019. The company's operating profit (PBDIT) has shown a notable increase, climbing from INR 29.39 crore in March 2019 to INR 138.00 crore in March 2025, although the operating profit margin has slightly decreased from 19.17% in March 2024 to 17.36% in March 2025. Profit before tax has also improved, reaching INR 107.90 crore in March 2025 compared to INR 14.62 crore in March 2019. Consequently, profit after tax has risen to INR 87.03 crore in March 2025 from INR 8.54 crore in March 2019. The total assets of the company have expanded from INR 284.56 crore in March 2020 to INR 738.69 crore in March 2025, while total liabilities have also increased, indicating a growing scale of operations. Cash flow from operating activities has varied, with a notable cash outflow of INR 18.00 crore in March 2025, down from an inflow of INR 22.00 crore in March 2024. Overall, Jash Engineering demonstrates a robust growth pattern in sales and profitability, despite fluctuations in cash flow.

View full answer

Is Jash Engineering overvalued or undervalued?

19-Nov-2025

As of November 18, 2025, Jash Engineering is considered overvalued with a valuation grade of "expensive," reflected by a PE ratio of 38.13, a Price to Book Value of 6.80, and an EV to EBITDA ratio of 25.29, significantly higher than its peers, alongside a recent stock decline of 2.81%.

As of 18 November 2025, Jash Engineering's valuation grade has moved from very expensive to expensive. The company is currently considered overvalued based on its financial ratios. The PE ratio stands at 38.13, while the Price to Book Value is 6.80, and the EV to EBITDA ratio is 25.29, indicating a premium valuation compared to its peers.<BR><BR>In comparison to its industry peers, Jash Engineering's PE ratio is significantly higher than that of Elecon Engineering, which has a PE of 26.82, and Action Construction Equipment at 27.69. Additionally, the company has a PEG ratio of 0.00, suggesting no growth expectations factored into its valuation. Recent stock performance shows a decline of 2.81% over the past week, contrasting with a 0.96% gain in the Sensex, which further emphasizes the overvaluation sentiment surrounding Jash Engineering.

View full answer

Is Jash Engineering technically bullish or bearish?

02-Dec-2025

As of December 1, 2025, Jash Engineering's technical trend is mildly bearish, indicated by a bearish MACD and Bollinger Bands on the weekly timeframe, with the current price at 460.00 below the previous close of 467.65.

As of 1 December 2025, the technical trend for Jash Engineering has changed from sideways to mildly bearish. The weekly MACD shows a bearish stance, and the Bollinger Bands are also indicating a bearish trend on the weekly timeframe. The Dow Theory aligns with this, showing a mildly bearish outlook on the weekly chart, while the monthly indicators show no clear trend. The current price of 460.00 is below the previous close of 467.65, further supporting the bearish sentiment. Overall, the technical stance is mildly bearish, driven primarily by the bearish signals in the MACD and Bollinger Bands on the weekly timeframe.

View full answer

Are Jash Engineering Ltd latest results good or bad?

14-Feb-2026

Jash Engineering Ltd's latest results are considered bad, showing a 61.75% decline in net profit year-on-year and an 11.17% drop in revenue, alongside a significant contraction in operating margins due to rising employee costs. Overall, the financial performance reflects substantial operational challenges.

The latest results for Jash Engineering Ltd indicate a concerning performance. In the third quarter of FY26, the company reported a net profit of ₹13.41 crores, which represents a significant decline of 61.75% year-on-year. Revenue also fell by 11.17% year-on-year, totaling ₹160.50 crores. <BR><BR>Moreover, the operating margin has contracted dramatically, dropping to 10.57% from 22.54% in the same quarter last year. This decline in profitability is attributed to rising employee costs, which increased to ₹38.48 crores, up from ₹32.10 crores year-on-year.<BR><BR>While there was a slight sequential improvement in net profit compared to the previous quarter, the overall financial trend is classified as negative due to the substantial year-on-year declines in both revenue and profit margins. The company's nine-month performance for FY26 also reflects these challenges, with a net profit drop of 62.24% compared to the previous year.<BR><BR>In summary, the latest results for Jash Engineering Ltd are considered bad, highlighting significant operational challenges and a need for strategic improvements.

View full answer

Should I buy, sell or hold Jash Engineering Ltd?

10-Mar-2026

Why is Jash Engineering Ltd falling/rising?

12-Mar-2026

As of 11-Mar, Jash Engineering Ltd's stock price is rising to 376.00, reflecting a 4.07% increase after three days of decline, indicating a potential trend reversal. However, the company faces challenges with negative financial results over the last three quarters and a high Price to Book Value ratio, which may deter some investors.

As of 11-Mar, Jash Engineering Ltd's stock price is rising, currently at 376.00, which reflects a change of 14.7 (4.07%) upward. This increase is notable as it comes after three consecutive days of decline, indicating a potential trend reversal. The stock has outperformed its sector by 3.73% today, and it reached an intraday high of Rs 388.6, marking a 7.56% increase at that peak.<BR><BR>Additionally, there has been a significant rise in investor participation, with delivery volume increasing by 35.88% compared to the five-day average, suggesting growing interest among investors. However, despite this positive movement, the stock is still trading below its moving averages across various time frames, which indicates that it may not have fully regained its strength.<BR><BR>On the downside, the company has reported negative results for the last three consecutive quarters, with substantial declines in profit before tax and profit after tax. The company also has a high Price to Book Value ratio of 5.3, suggesting it is trading at a premium compared to its peers, which may deter some investors. Furthermore, the lack of investment from domestic mutual funds, which hold 0% of the company, could indicate a lack of confidence in its valuation or business prospects.<BR><BR>In summary, while Jash Engineering Ltd is experiencing a rise in stock price due to a trend reversal and increased investor participation, it faces significant challenges from its recent financial performance and valuation concerns.

View full answer

Why is Jash Engineering Ltd falling/rising?

13-Mar-2026

As of 12-Mar, Jash Engineering Ltd's stock price is Rs 374.65, down 0.41%, with significant declines over various periods and negative financial results for the last three quarters. The stock is trading below key moving averages and has a high Price to Book Value, indicating bearish sentiment and lack of investor confidence.

As of 12-Mar, Jash Engineering Ltd's stock price is falling, currently at Rs 374.65, reflecting a decrease of Rs 1.55 or 0.41%. The stock has underperformed significantly over various periods, with a 1-week decline of 9.35% and a year-to-date drop of 14.80%, compared to the Sensex which has fallen only 10.78% in the same timeframe. <BR><BR>Today's performance indicates a challenging environment, as the stock touched an intraday low of Rs 363.15, representing a decline of 3.47%. Furthermore, Jash Engineering is trading below its 5-day, 20-day, 50-day, 100-day, and 200-day moving averages, which typically signals bearish sentiment among investors. <BR><BR>The company has also reported negative financial results for the last three consecutive quarters, with a significant decline in profit after tax (PAT) by 51.89% and a staggering drop in profit before tax (PBT) of 73.55%. Additionally, the return on capital employed (ROCE) is at its lowest at 19.37%, and the stock is trading at a premium compared to its peers, indicated by a high Price to Book Value of 5.3. <BR><BR>Despite a strong ability to service debt, as evidenced by a low Debt to EBITDA ratio of 0.52 times, the overall negative financial performance and lack of domestic mutual fund investment—indicating a lack of confidence in the stock—contribute to its declining price.

View full answer
iScoreScore
Click here to find our call on this stock
Strong Sell
Sell
Hold
Buy
Strong Buy

Dashboard

1

The company has declared Negative results for the last 3 consecutive quarters

  • PAT(Latest six months) At Rs 24.57 cr has Grown at -51.89%
  • PBT LESS OI(Q) At Rs 8.83 cr has Fallen at -73.55%
  • ROCE(HY) Lowest at 19.37%
2

With ROE of 17.5, it has a Expensive valuation with a 5.2 Price to Book Value

3

Despite the size of the company, domestic mutual funds hold only 0% of the company

stock-summaryMojo Parameters

Mojo Parameters

Loading Valuation Snapshot...

Stock DNA

stock-summary
Industry

Industrial Manufacturing

stock-summary
Market cap

INR 2,329 Cr (Small Cap)

stock-summary
P/E

41.00

stock-summary
Industry P/E

32

stock-summary
Dividend Yield

0.32%

stock-summary
Debt Equity

-0.02

stock-summary
Return on Equity

17.46%

stock-summary
Price to Book

5.33

Revenue and Profits:
Net Sales:
160 Cr
(Quarterly Results - Dec 2025)
Net Profit:
13 Cr
stock-summaryTotal Returns
Total Returns (Price + Dividend) stock-summary
Dividend Yield (0.32%)
TimePeriod
Price Return
Dividend Return
Total Return
3 Months
-17.74%
0%
-17.74%
6 Months
-29.1%
0%
-29.1%
1 Year
0%
0%
0.0%
2 Years
0%
0%
0.0%
3 Years
0%
0%
0.0%
4 Years
0%
0%
0.0%
5 Years
0%
0%
0.0%

Latest dividend: 1.2 per share ex-dividend date: Sep-09-2025

Risk Adjusted Returns v/s stock-summary
Returns Beta
Icon
Beta has not been calculated since enough price history is not available
stock-summaryNews & Corporate Actions

News

Why is Jash Engineering Ltd falling/rising?

Recent Price Movements and Market Comparison

Jash Engineering’s share price has been on a downward trajectory over recent weeks. In the past week alone, the stock has fallen by 6.88%, nearly double the Sensex’s decline of 3.33%. Over the last month, the stock’s loss widened to 9.11%, again underperforming the Sensex’s 7.73% drop. Year-to-date, the stock has declined by 15.25%, considerably worse than the Sensex’s 8.98% fall. This persistent underperformance signals growing investor concerns about the company’s prospects.

On the day in question, the stock opened with a gap down of 3.59%, setting a negative tone for the session. It further touched an intraday low of ₹366.55, marking a 6.01% decline from the previous close. The stock’s price remains below all key moving a...

Read full news article
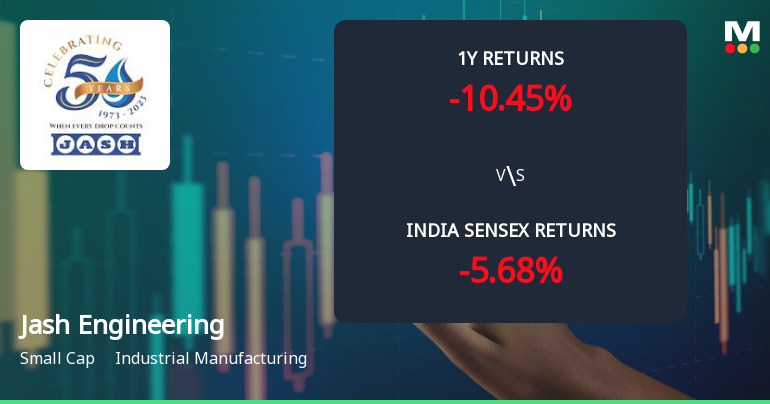
Jash Engineering Ltd Declines 2.27% Despite Technical Stabilisation: 5 Key Developments This Week

Announcements stock-summary

Announcement under Regulation 30 (LODR)-Allotment of ESOP / ESPS

11-Mar-2026 | Source : BSE

Allotment of 288600 equity shares under ESOP

Corporate Announcement

11-Mar-2026 | Source : BSE

Corporate Announcement

Disclosures under Reg. 29(2) of SEBI (SAST) Regulations 2011

23-Feb-2026 | Source : BSE

The Exchange has received the disclosure under Regulation 29(2) of SEBI (Substantial Acquisition of Shares & Takeovers) Regulations 2011 for Rahul Patel

Corporate Actions stock-summary

stock-summary
BOARD MEETING

No Upcoming Board Meetings

stock-summary
DIVIDEND

Jash Engineering Ltd has declared 60% dividend, ex-date: 09 Sep 25

stock-summary
SPLITS

Jash Engineering Ltd has announced 2:10 stock split, ex-date: 30 Oct 24

stock-summary
BONUS

No Bonus history available

stock-summary
RIGHTS

No Rights history available

stock-summaryKey Factors

Quality key factors stock-summary

Factor
Value
Sales Growth (5y)
23.61%
EBIT Growth (5y)
22.72%
EBIT to Interest (avg)
6.06
Debt to EBITDA (avg)
1.24
Net Debt to Equity (avg)
-0.02
Sales to Capital Employed (avg)
1.33
Tax Ratio
23.79%
Dividend Payout Ratio
13.96%
Pledged Shares
0
Institutional Holding
2.49%
ROCE (avg)
21.57%
ROE (avg)
20.24%

Valuation key factors

Factor
Value
P/E Ratio
41
Industry P/E
32
Price to Book Value
5.21
EV to EBIT
32.45
EV to EBITDA
24.91
EV to Capital Employed
5.30
EV to Sales
3.08
PEG Ratio
NA
Dividend Yield
0.33%
ROCE (Latest)
22.15%
ROE (Latest)
17.46%

Technicals key factors

Indicator
Weekly
Monthly
MACD
Mildly Bullish
RSI
No Signal
Bollinger Bands
Bearish
Moving Averages
Bearish (Daily)
KST
Dow Theory
Mildly Bearish
Mildly Bullish
OBV
Mildly Bullish
No Trend
stock-summary Technical Indicator Scale: Bearish, Mildly Bearish, Sideways, Mildly Bullish, Bullish  Turned 
stock-summaryShareholding
Shareholding Snapshot : Dec 2025stock-summary
Shareholding Compare (%holding) stock-summary
Majority shareholders

Non Institution

Pledged Promoter Holdings

None

Mutual Funds

Held by 0 Schemes

FIIs

Held by 35 FIIs (2.0%)

Promoter with highest holding

Pratik Patel (12.05%)

Highest Public shareholder

Axel Schutte (3.96%)

Individual Investors Holdings

37.52%

stock-summaryFinancial
[
  {
    "link": "quarterly",
    "btn_text": "All Quarterly Results",
    "header": "Quarterly Results Snapshot (Consolidated) - Dec'25 - YoY",
    "rhs": [
      {
        "prefix": "Net Sales ",
        "suffix": "YoY Growth in quarter ended Dec 2025 is -11.17% vs 29.86% in Dec 2024",
        "dir": -1
      },
      {
        "prefix": "Consolidated Net Profit ",
        "suffix": "YoY Growth in quarter ended Dec 2025 is -61.75% vs 54.86% in Dec 2024",
        "dir": -1
      }
    ],
    "table": {
      "header": [
        "Dec'25",
        "Dec'24",
        "Change(%)"
      ],
      "body": [
        {
          "field": "Net Sales",
          "val1": "160.50",
          "val2": "180.68",
          "chgp": "-11.17%",
          "chgp_class": "negative"
        },
        {
          "field": "Operating Profit (PBDIT) excl Other Income",
          "val1": "16.96",
          "val2": "40.72",
          "chgp": "-58.35%",
          "chgp_class": "negative"
        },
        {
          "field": "Interest",
          "val1": "3.05",
          "val2": "3.68",
          "chgp": "-17.12%",
          "chgp_class": "positive"
        },
        {
          "field": "Exceptional Items",
          "val1": "0.00",
          "val2": "0.00",
          "chgp": "",
          "chgp_class": "neutral"
        },
        {
          "field": "Consolidate Net Profit",
          "val1": "13.41",
          "val2": "35.06",
          "chgp": "-61.75%",
          "chgp_class": "negative"
        },
        {
          "field": "Operating Profit Margin (Excl OI)",
          "val1": "10.57%",
          "val2": "22.54%",
          "chgp": "-11.97%",
          "chgp_class": "negative"
        }
      ]
    }
  },
  {
    "link": "half-yearly",
    "btn_text": "All Half Yearly Results",
    "header": "Half Yearly Results Snapshot (Consolidated) - Sep'25",
    "rhs": [
      {
        "prefix": "Net Sales ",
        "suffix": " Growth in half year ended Sep 2025 is 12.21% vs 59.46% in Sep 2024",
        "dir": -1
      },
      {
        "prefix": "Consolidated Net Profit ",
        "suffix": " Growth in half year ended Sep 2025 is -63.17% vs 219.34% in Sep 2024",
        "dir": -1
      }
    ],
    "table": {
      "header": [
        "Sep'25",
        "Sep'24",
        "Change(%)"
      ],
      "body": [
        {
          "field": "Net Sales",
          "val1": "285.15",
          "val2": "254.13",
          "chgp": "12.21%",
          "chgp_class": "positive"
        },
        {
          "field": "Operating Profit (PBDIT) excl Other Income",
          "val1": "16.32",
          "val2": "28.02",
          "chgp": "-41.76%",
          "chgp_class": "negative"
        },
        {
          "field": "Interest",
          "val1": "6.35",
          "val2": "5.45",
          "chgp": "16.51%",
          "chgp_class": "negative"
        },
        {
          "field": "Exceptional Items",
          "val1": "0.00",
          "val2": "0.00",
          "chgp": "",
          "chgp_class": "neutral"
        },
        {
          "field": "Consolidate Net Profit",
          "val1": "6.08",
          "val2": "16.51",
          "chgp": "-63.17%",
          "chgp_class": "negative"
        },
        {
          "field": "Operating Profit Margin (Excl OI)",
          "val1": "5.72%",
          "val2": "11.03%",
          "chgp": "-5.31%",
          "chgp_class": "negative"
        }
      ]
    }
  },
  {
    "link": "nine-monthly",
    "btn_text": "All Nine Monthly Results",
    "header": "Nine Monthly Results Snapshot (Consolidated) - Dec'25",
    "rhs": [
      {
        "prefix": "Net Sales ",
        "suffix": "YoY Growth in nine months ended Dec 2025 is 2.49% vs 45.66% in Dec 2024",
        "dir": -1
      },
      {
        "prefix": "Consolidated Net Profit ",
        "suffix": "YoY Growth in nine months ended Dec 2025 is -62.21% vs 85.44% in Dec 2024",
        "dir": -1
      }
    ],
    "table": {
      "header": [
        "Dec'25",
        "Dec'24",
        "Change(%)"
      ],
      "body": [
        {
          "field": "Net Sales",
          "val1": "445.65",
          "val2": "434.81",
          "chgp": "2.49%",
          "chgp_class": "positive"
        },
        {
          "field": "Operating Profit (PBDIT) excl Other Income",
          "val1": "33.28",
          "val2": "68.74",
          "chgp": "-51.59%",
          "chgp_class": "negative"
        },
        {
          "field": "Interest",
          "val1": "9.40",
          "val2": "9.13",
          "chgp": "2.96%",
          "chgp_class": "negative"
        },
        {
          "field": "Exceptional Items",
          "val1": "0.00",
          "val2": "0.00",
          "chgp": "",
          "chgp_class": "neutral"
        },
        {
          "field": "Consolidate Net Profit",
          "val1": "19.49",
          "val2": "51.57",
          "chgp": "-62.21%",
          "chgp_class": "negative"
        },
        {
          "field": "Operating Profit Margin (Excl OI)",
          "val1": "7.47%",
          "val2": "15.81%",
          "chgp": "-8.34%",
          "chgp_class": "negative"
        }
      ]
    }
  },
  {
    "link": "annual",
    "btn_text": "All Annual Results",
    "header": "Annual Results Snapshot (Consolidated) - Mar'25",
    "rhs": [
      {
        "prefix": "Net Sales ",
        "suffix": "YoY Growth in year ended Mar 2025 is 42.57% vs 28.28% in Mar 2024",
        "dir": 1
      },
      {
        "prefix": "Consolidated Net Profit ",
        "suffix": "YoY Growth in year ended Mar 2025 is 31.35% vs 29.15% in Mar 2024",
        "dir": 1
      }
    ],
    "table": {
      "header": [
        "Mar'25",
        "Mar'24",
        "Change(%)"
      ],
      "body": [
        {
          "field": "Net Sales",
          "val1": "735.19",
          "val2": "515.67",
          "chgp": "42.57%",
          "chgp_class": "positive"
        },
        {
          "field": "Operating Profit (PBDIT) excl Other Income",
          "val1": "127.63",
          "val2": "98.85",
          "chgp": "29.11%",
          "chgp_class": "positive"
        },
        {
          "field": "Interest",
          "val1": "13.07",
          "val2": "11.03",
          "chgp": "18.50%",
          "chgp_class": "negative"
        },
        {
          "field": "Exceptional Items",
          "val1": "0.00",
          "val2": "0.00",
          "chgp": "",
          "chgp_class": "neutral"
        },
        {
          "field": "Consolidate Net Profit",
          "val1": "87.70",
          "val2": "66.77",
          "chgp": "31.35%",
          "chgp_class": "positive"
        },
        {
          "field": "Operating Profit Margin (Excl OI)",
          "val1": "17.36%",
          "val2": "19.17%",
          "chgp": "-1.81%",
          "chgp_class": "negative"
        }
      ]
    }
  }
]

Quarterly Results Snapshot (Consolidated) - Dec'25 - YoYstock-summary

Dec'25
Dec'24
Change(%)
Net Sales
160.50
180.68
-11.17%
Operating Profit (PBDIT) excl Other Income
16.96
40.72
-58.35%
Interest
3.05
3.68
-17.12%
Exceptional Items
0.00
0.00
Consolidate Net Profit
13.41
35.06
-61.75%
Operating Profit Margin (Excl OI)
10.57%
22.54%
-11.97%
Values in Rs Cr.
Direction Arrows
Net Sales

YoY Growth in quarter ended Dec 2025 is -11.17% vs 29.86% in Dec 2024

Direction Arrows
Consolidated Net Profit

YoY Growth in quarter ended Dec 2025 is -61.75% vs 54.86% in Dec 2024

Half Yearly Results Snapshot (Consolidated) - Sep'25stock-summary

Sep'25
Sep'24
Change(%)
Net Sales
285.15
254.13
12.21%
Operating Profit (PBDIT) excl Other Income
16.32
28.02
-41.76%
Interest
6.35
5.45
16.51%
Exceptional Items
0.00
0.00
Consolidate Net Profit
6.08
16.51
-63.17%
Operating Profit Margin (Excl OI)
5.72%
11.03%
-5.31%
Values in Rs Cr.
Direction Arrows
Net Sales

Growth in half year ended Sep 2025 is 12.21% vs 59.46% in Sep 2024

Direction Arrows
Consolidated Net Profit

Growth in half year ended Sep 2025 is -63.17% vs 219.34% in Sep 2024

Nine Monthly Results Snapshot (Consolidated) - Dec'25stock-summary

Dec'25
Dec'24
Change(%)
Net Sales
445.65
434.81
2.49%
Operating Profit (PBDIT) excl Other Income
33.28
68.74
-51.59%
Interest
9.40
9.13
2.96%
Exceptional Items
0.00
0.00
Consolidate Net Profit
19.49
51.57
-62.21%
Operating Profit Margin (Excl OI)
7.47%
15.81%
-8.34%
Values in Rs Cr.
Direction Arrows
Net Sales

YoY Growth in nine months ended Dec 2025 is 2.49% vs 45.66% in Dec 2024

Direction Arrows
Consolidated Net Profit

YoY Growth in nine months ended Dec 2025 is -62.21% vs 85.44% in Dec 2024

Annual Results Snapshot (Consolidated) - Mar'25stock-summary

Mar'25
Mar'24
Change(%)
Net Sales
735.19
515.67
42.57%
Operating Profit (PBDIT) excl Other Income
127.63
98.85
29.11%
Interest
13.07
11.03
18.50%
Exceptional Items
0.00
0.00
Consolidate Net Profit
87.70
66.77
31.35%
Operating Profit Margin (Excl OI)
17.36%
19.17%
-1.81%
Values in Rs Cr.
Direction Arrows
Net Sales

YoY Growth in year ended Mar 2025 is 42.57% vs 28.28% in Mar 2024

Direction Arrows
Consolidated Net Profit

YoY Growth in year ended Mar 2025 is 31.35% vs 29.15% in Mar 2024

stock-summaryCompany CV
About Jash Engineering Ltd stock-summary
stock-summary
Jash Engineering Ltd
Small Cap
Industrial Manufacturing
Jash Engineering Limited was incorporated as a Private Limited Company with the name "Jash Engineering Industries Private Limited" on September 29, 1973. Subsequently, Company name was changed to Jash Engineering Private Limited on January 29, 1976. The Company got converted into a Public Limited Company and the name of the Company was changed to "Jash Engineering Limited" on September 21, 1994. The Company Promoters are Mr. Laxminandan Amin, Mr. Pratik Patel, Ms. Bhairavi Patel and Mr.
Company Coordinates stock-summary
Company Details
31 Sector-C Industrial Area, Sanwer Road Indore Madhya Pradesh : 452015
stock-summary
Tel: 91-731-2720143/2721143/4232900
stock-summary
Registrar Details
Link Intime India Pvt Ltd, C-13 Pannalal Silk Compound, L B S Marg, Bhandup , Mumbai