
Compare Jay Bharat Maru. with Similar Stocks
Dashboard
With a growth in Net Profit of 308.84%, the company declared Very Positive results in Mar 26
- The company has declared positive results for the last 5 consecutive quarters
- PAT(Latest six months) At Rs 97.96 cr has Grown at 300.16%
- ROCE(HY) Highest at 15.75%
- OPERATING PROFIT TO INTEREST(Q) Highest at 7.75 times
With ROCE of 15.4, it has a Very Attractive valuation with a 1.9 Enterprise value to Capital Employed
Market Beating performance in long term as well as near term
Stock DNA
Auto Components & Equipments
INR 1,891 Cr (Micro Cap)
13.00
38
0.41%
0.76
20.07%
2.67
Total Returns (Price + Dividend) 
Latest dividend: 0.7 per share ex-dividend date: Aug-26-2025
Risk Adjusted Returns v/s
Returns Beta

News
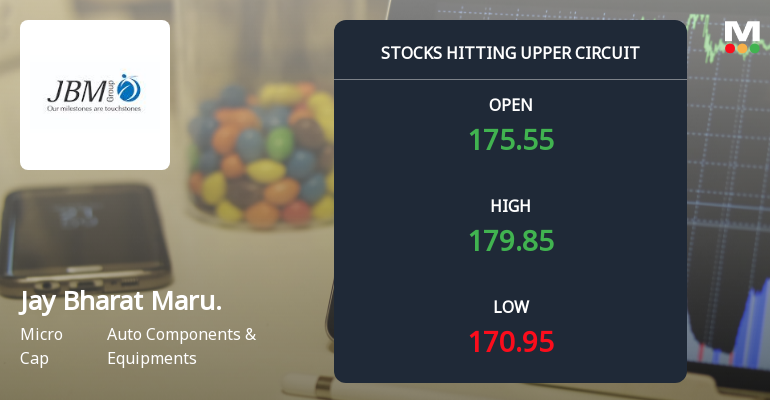
Jay Bharat Maruti Ltd Locks at Upper Circuit With 5% Gain — Buyers Queue, Sellers Absent
At Rs 180.12, the buying was done — not because demand dried up, but because the exchange wouldn't let the stock go any higher. Jay Bharat Maruti Ltd locked at its upper circuit of 5% on 6 Jul 2026, with buyers queuing and no sellers willing to part with shares.
Read full news article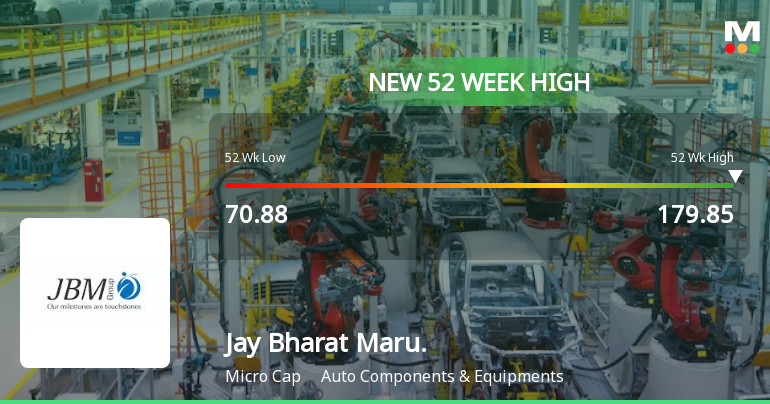
Broad-Based Technical Strength Lifts Jay Bharat Maruti Ltd to 52-Week High of Rs 179.85
Surging past its previous peaks, Jay Bharat Maruti Ltd touched a fresh 52-week high of Rs 179.85 on 6 Jul 2026, marking a remarkable rally of 154.97% from its 52-week low of Rs 70.88. This milestone reflects a powerful momentum driven by a confluence of bullish technical indicators and sustained price strength.
Read full news article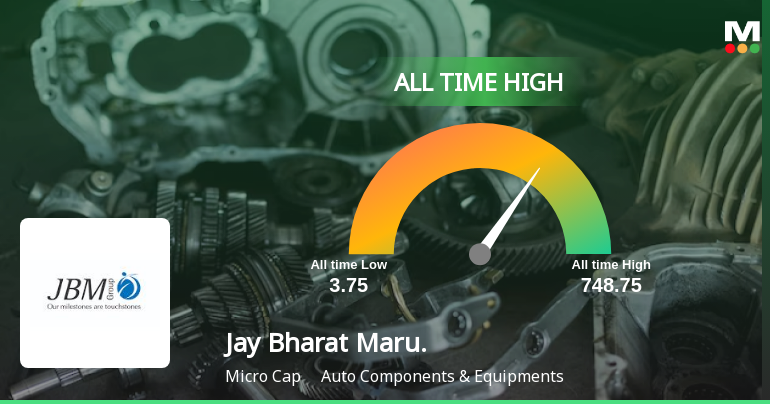
Jay Bharat Maruti Ltd Hits All-Time High of Rs 179.85 as Momentum Builds Across Timeframes
Extending its recent rally, Jay Bharat Maruti Ltd touched a fresh all-time high of Rs 179.85 on 6 Jul 2026, marking a significant milestone in its price journey amid strong technical and fundamental signals.
Read full news article Announcements
Compliances-Certificate under Reg. 74 (5) of SEBI (DP) Regulations 2018
03-Jul-2026 | Source : BSECertificate pursuant to Regulation 74(5) of SEBI (DP) Regulations 2018
Intimation Of Approval Of Voluntary Delisting Of Equity Shares Of The Company From The Calcutta Stock Exchange (CSE)
03-Jul-2026 | Source : BSEIntimation of approval of Voluntary Delisting of Equity Shares of the Company from the Calcutta Stock Exchange (CSE)
Announcement under Regulation 30 (LODR)-Newspaper Publication
02-Jul-2026 | Source : BSECopy of Newspaper Publications.
Corporate Actions

No Upcoming Board Meetings

Jay Bharat Maruti Ltd has declared 35% dividend, ex-date: 26 Aug 25

Jay Bharat Maruti Ltd has announced 2:5 stock split, ex-date: 26 Oct 23

Jay Bharat Maruti Ltd has announced 1:1 bonus issue, ex-date: 07 Jun 21

No Rights history available
Quality key factors
Valuation key factors
Technicals key factors
 Technical Indicator Scale: Bearish, Mildly Bearish, Sideways, Mildly Bullish, Bullish Turned
 Shareholding Snapshot : Mar 2026
Shareholding Compare (%holding)
Promoters
None
Held by 4 Schemes (0.02%)
Held by 8 FIIs (1.32%)
Maruti Suzuki India Limited (29.28%)
Focal Leasing & Credits Limited (4.53%)
17.23%
Quarterly Results Snapshot (Consolidated) - Mar'26 - YoY

YoY Growth in quarter ended Mar 2026 is 25.44% vs 2.10% in Mar 2025
YoY Growth in quarter ended Mar 2026 is 287.11% vs 83.08% in Mar 2025
Half Yearly Results Snapshot (Consolidated) - Sep'25
Growth in half year ended Sep 2025 is 4.65% vs -5.03% in Sep 2024
Growth in half year ended Sep 2025 is 394.90% vs -40.93% in Sep 2024
Nine Monthly Results Snapshot (Consolidated) - Dec'25
YoY Growth in nine months ended Dec 2025 is 6.28% vs -0.86% in Dec 2024
YoY Growth in nine months ended Dec 2025 is 386.56% vs -41.16% in Dec 2024
Annual Results Snapshot (Consolidated) - Mar'26
YoY Growth in year ended Mar 2026 is 11.39% vs -0.09% in Mar 2025
YoY Growth in year ended Mar 2026 is 324.40% vs 2.17% in Mar 2025
About Jay Bharat Maruti Ltd

Company Coordinates


